SellerApp Stream: Optimize Your Dayparting Schedule With Real-time Data
As an Amazon seller, you know that the e-commerce landscape is dynamic, with shopper behavior fluctuating throughout the day.
This realization has led to the adoption of unique advertising strategies like “dayparting,” where advertisers adjust their bids based on specific hours to optimize the performance of Amazon PPC campaigns.
Up until recently, it has been challenging to get accurate hourly data on impressions, clicks, and orders to create a data-driven dayparting strategy.
However, with the SellerApp Stream, you can view weekly, daily, and hourly trends on your campaign performance for the last 90 days.
This level of granular data gives you ample insight to optimize dayparting schedules.
Let’s see how to use the SellerApp Stream to understand your customer behavior:
Accessing SellerApp Stream
- First, log in to the SellerApp dashboard from this link.
- Next, connect your Amazon Advertising account with SellerApp Dashboard. You can do it easily with this guide.
- Go to the Stream Dashboard inside Advertising from the left sidebar.
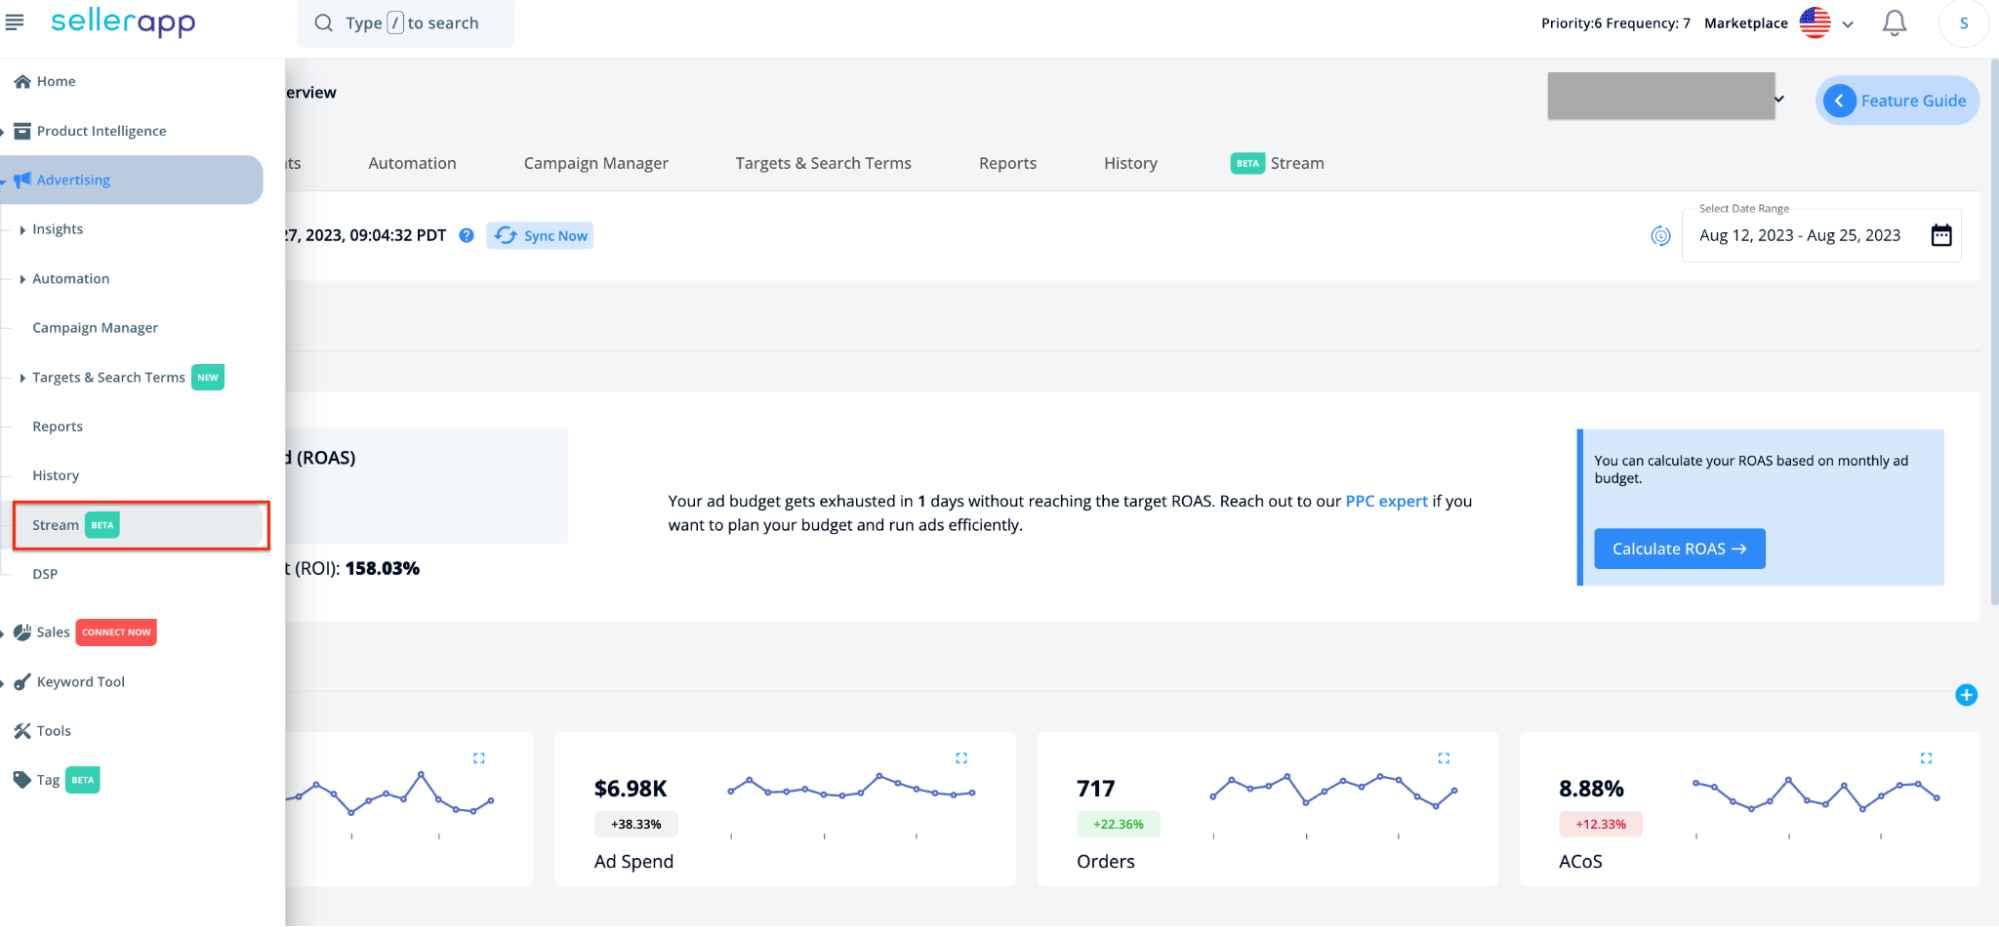
Note: SellerApp shows Stream data only up to the previous day. For instance, if today is August 20th, the dashboard will show data up to August 19th. If you connect your advertising account today, wait for 24 hours to start seeing data on the Stream.
Data Availability for Different Subscriptions
- Freemium Users: If you’re a freemium user, you can only access historical data for the last 7 days from the day you connected your advertising account.
- Paid Users: For paid users, unlike Seller Central, SellerApp provides a lookback window of 90 days from the day of connecting the advertising account.
Using the SellerApp Stream
- At the top of the Stream density chart, you can see “filter by” options. It has two primary levels of filtering: Account Level and Campaign Level.

Choose account level to understand your overall account performance, or choose a specific campaign to know how your campaign performs throughout the weeks.
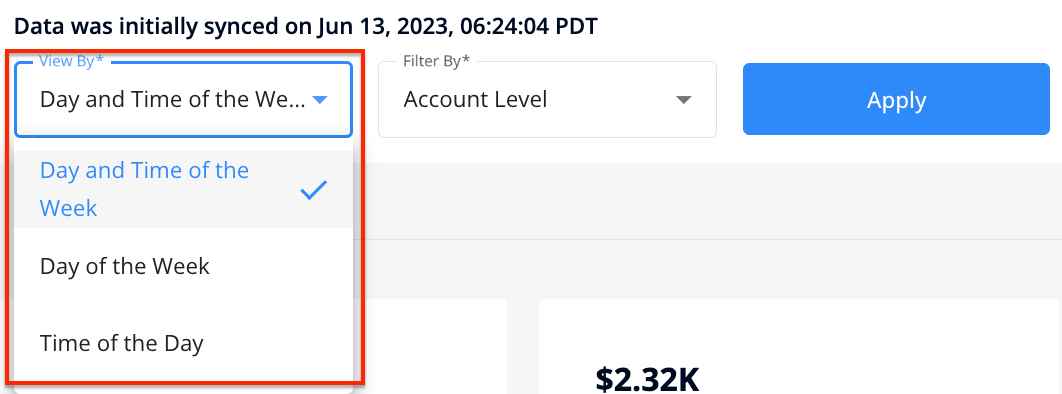
- Further, choose a view based on your preference:
- Day and Time of the Week,
- Day of the Week,
- And Time of the Day.
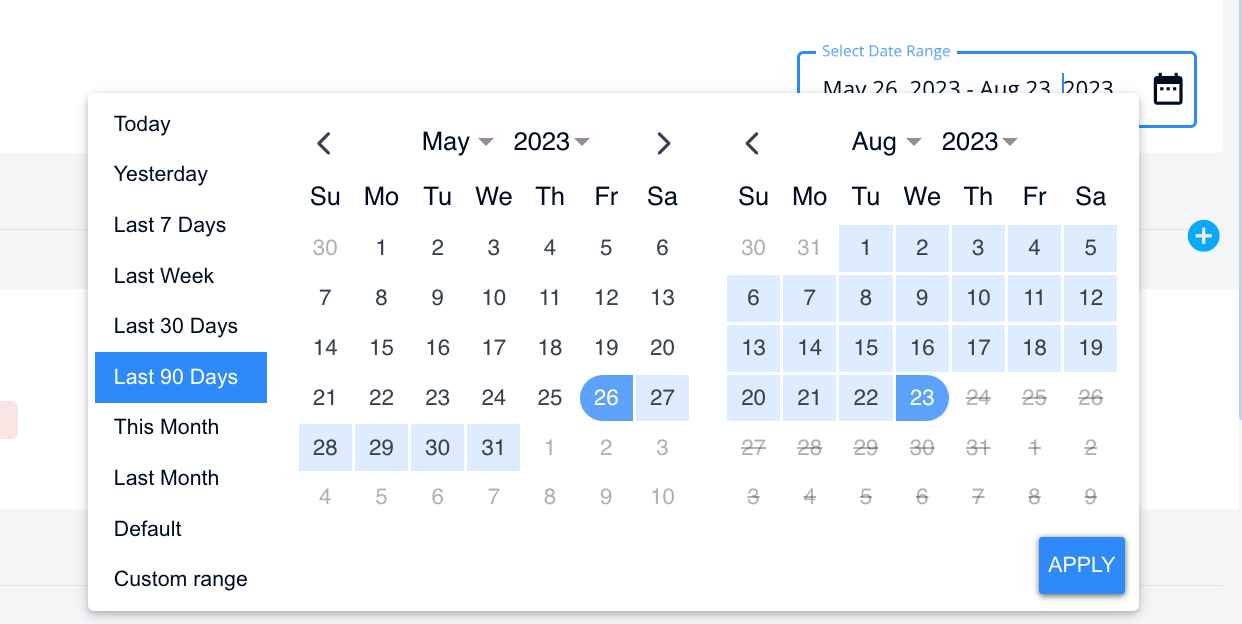
- After that, choose the date range from the date picker at the top right corner. You can choose a custom date range or select a pre-defined one.
Below, you can see an overview of your campaign/account level metrics (whichever option you choose).

After the overview, you can see the density chart – the heart of Stream. This visual representation lets you quickly grasp the trends and patterns for your advertising KPIs.
The density chart showcases data for a specific date range for your selected campaigns/account, providing insights into
- Attributed sales
- Spend
- ACOS
- Impressions
- Orders
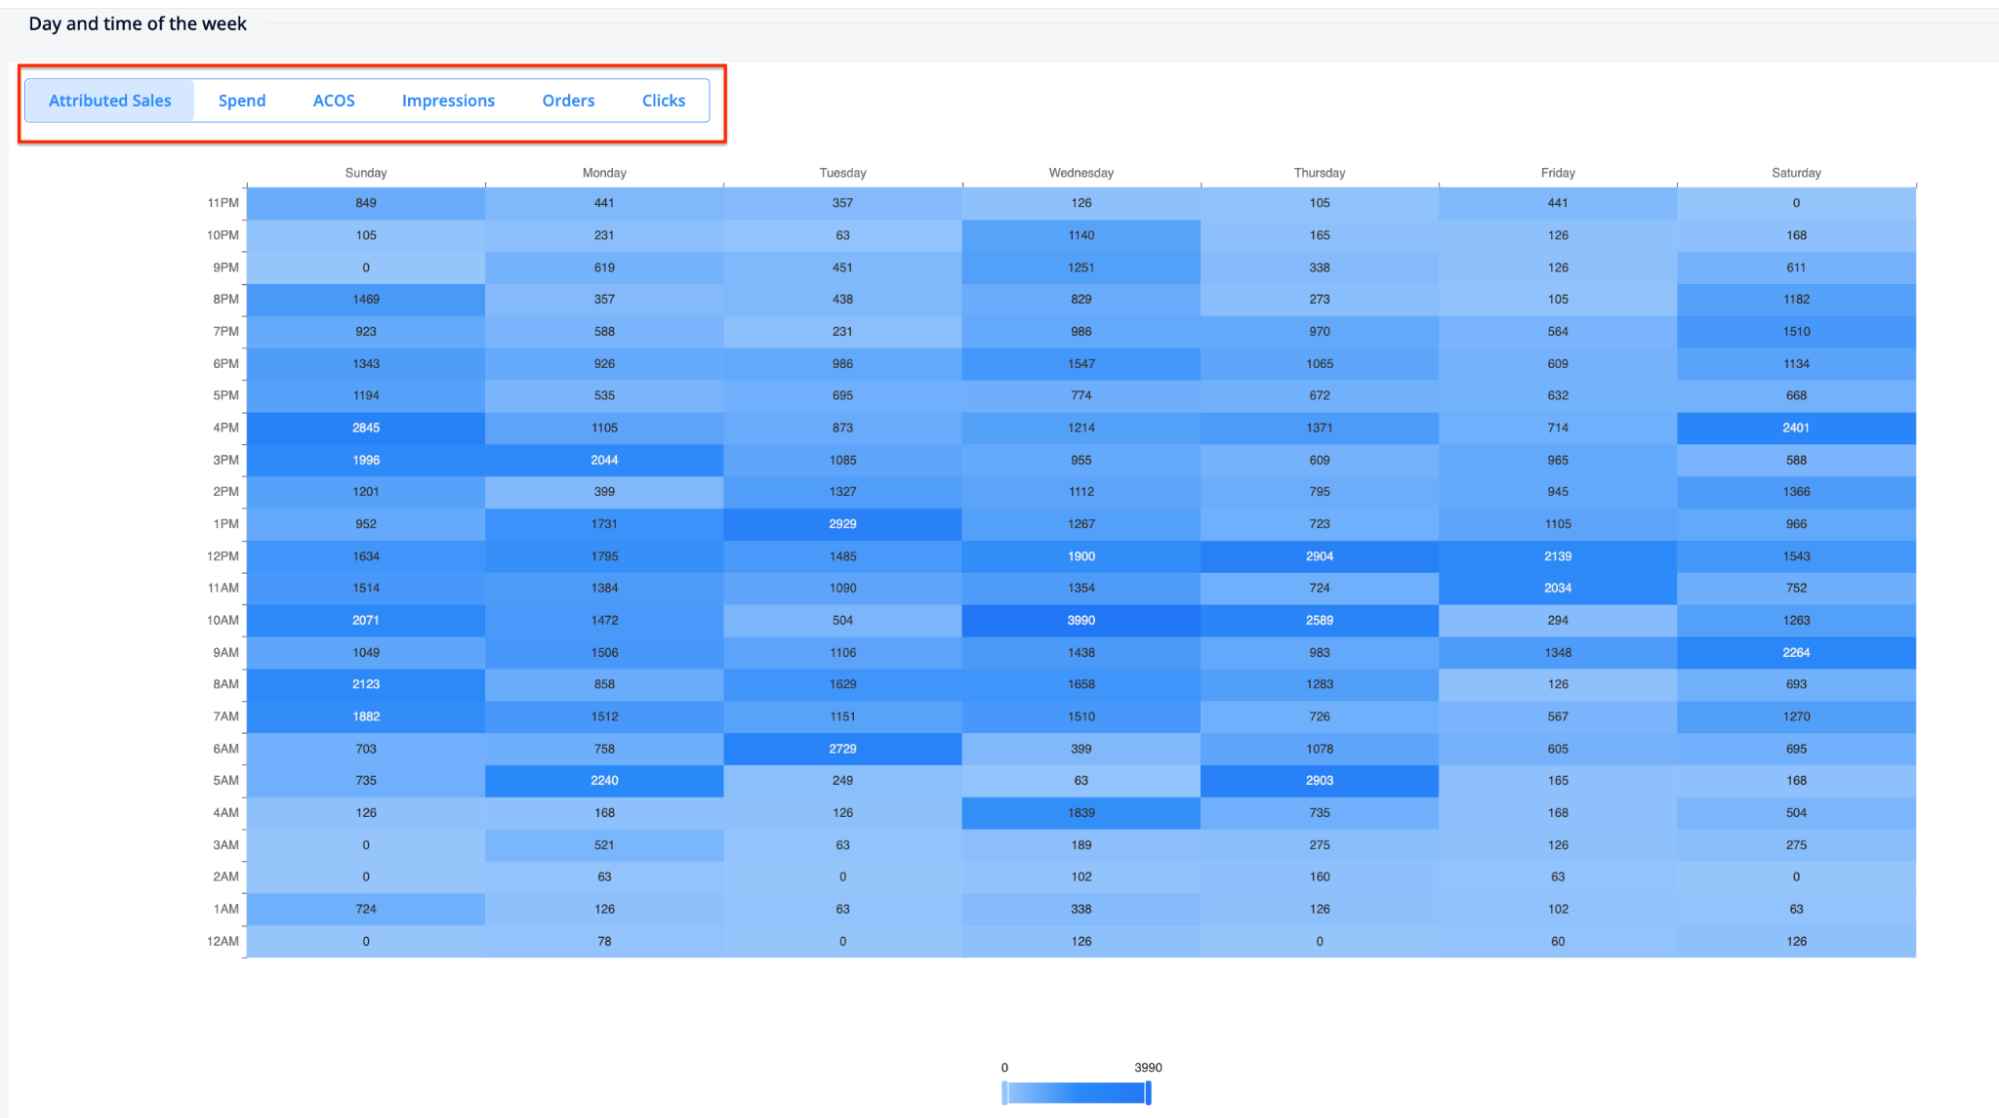
These metrics allow you to go deeper into your analysis and find which days of the week and what time of the day your account/campaign gets maximum attributed sales, orders, or impressions.
Now, let’s understand the different views SellerApp Stream offers:
Day And Time of the Week View
This view shows how your metrics perform throughout the week, broken down by the hours of each day.
How to Interpret the Density Chart
Darker colors (i.e., deeper blue shades that are higher in intensity) on the density chart represent higher values.
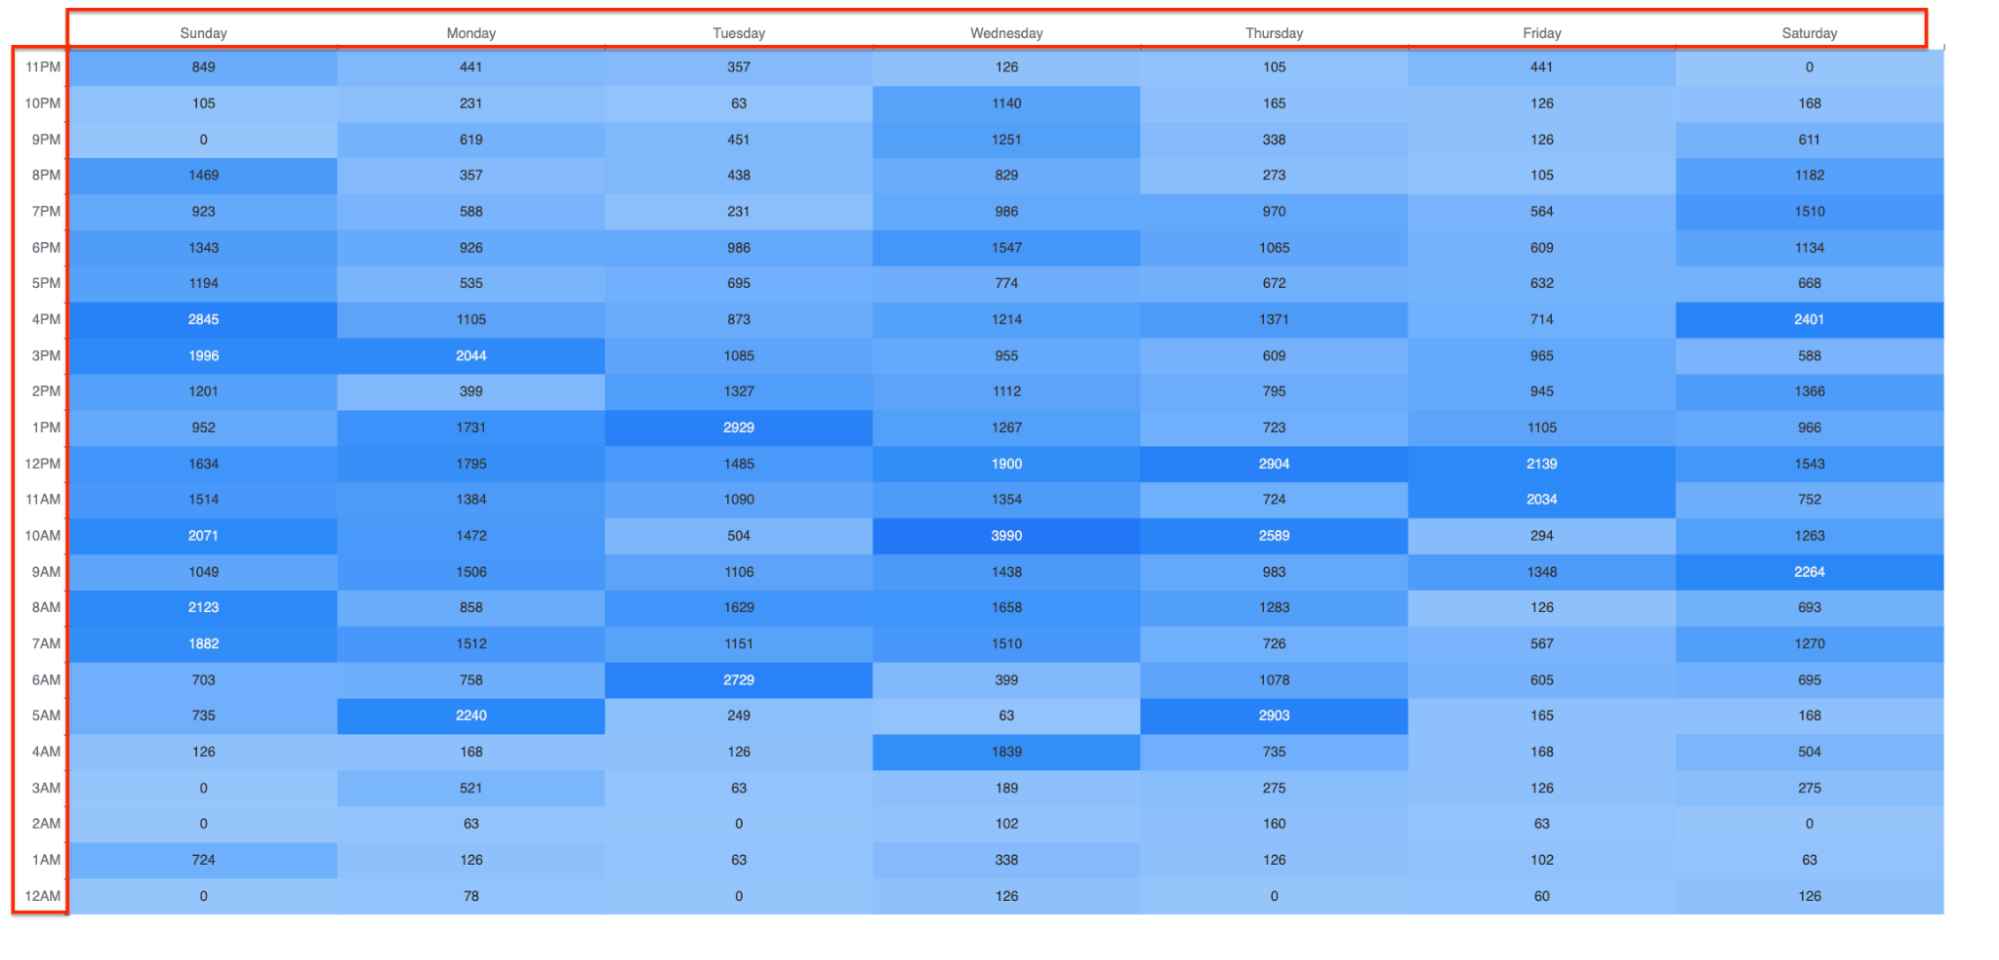
On the horizontal axis at the top, the columns of the grid are labeled by day of the week: Sunday, Monday, Tuesday, Wednesday, Thursday, Friday, and Saturday.
On the vertical axis to the left, you can see the hour starting at 12 a.m. at the bottom.
Below the density chart, a color legend is shown, with a slider to customize the density chart according to your needs.
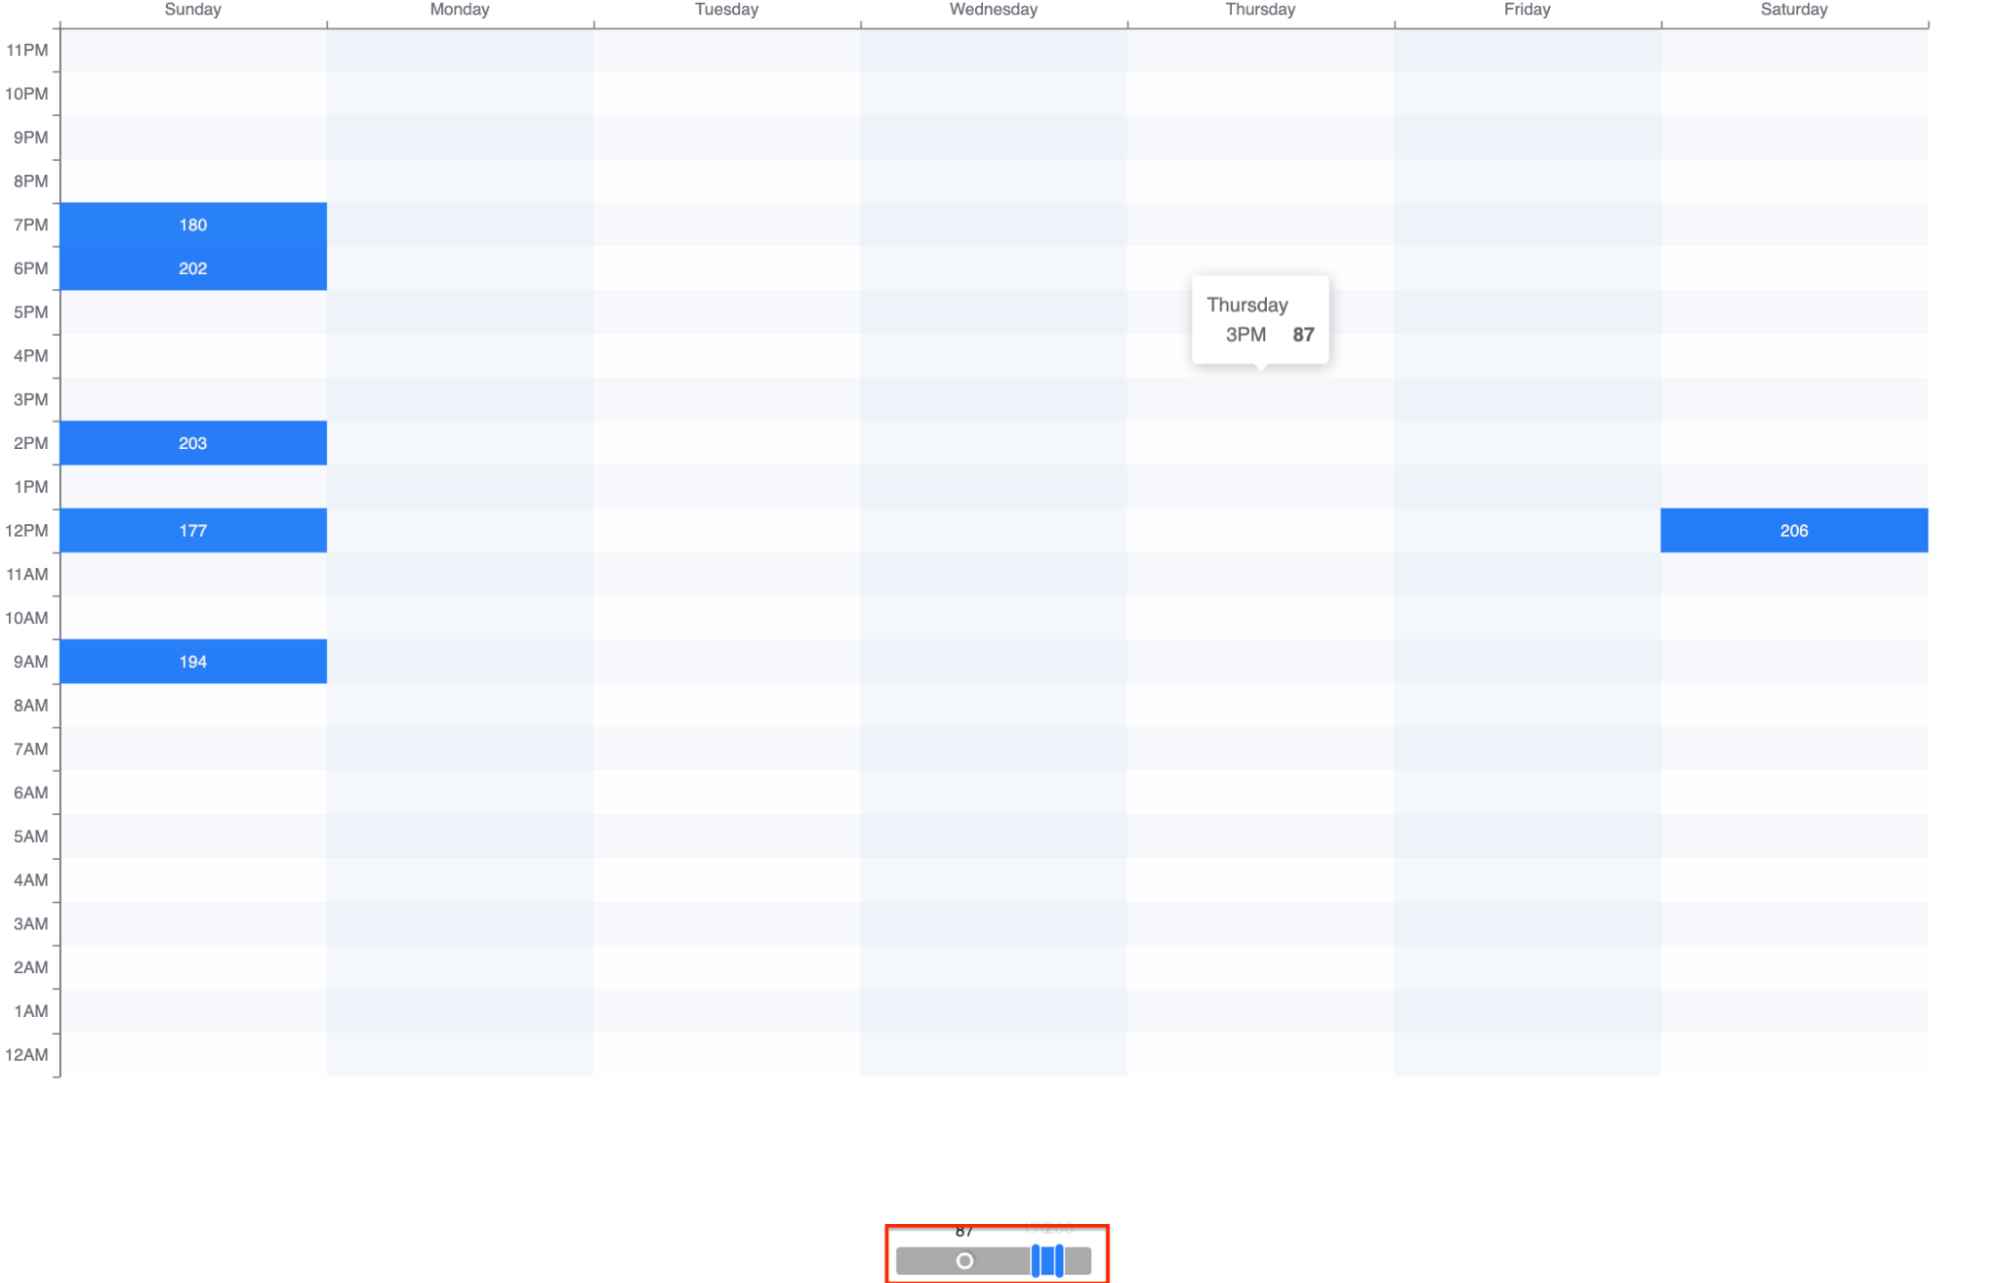
Let’s say, you want to see the days and times of the week your campaigns get 170-200 clicks; you can highlight that with the legend slider.
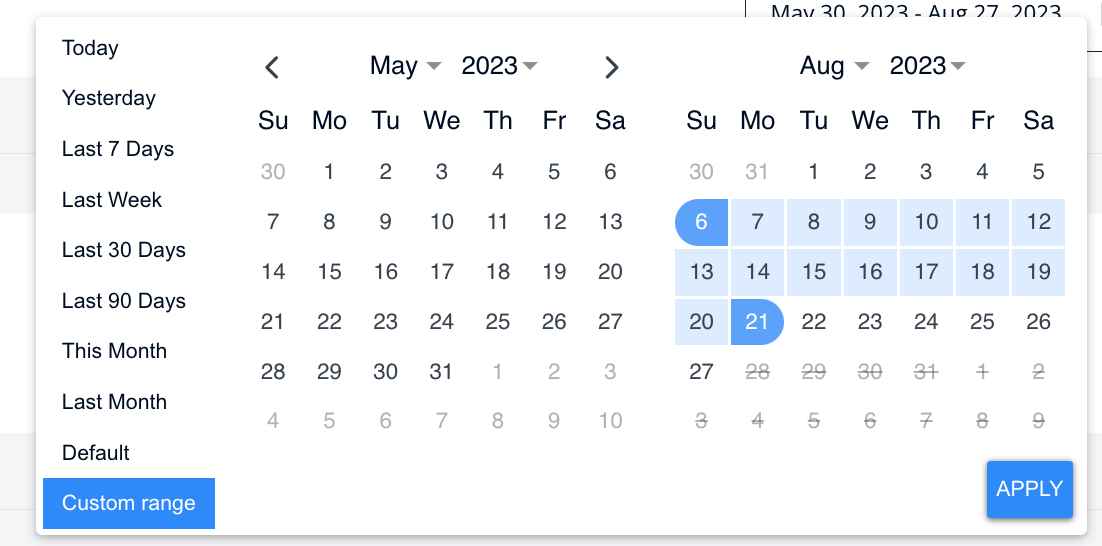
Note: Now, you might wonder why SellerApp Stream gives data for only 7 days even if you selected a date range greater than 7 days (e.g., 7th to 21st).
The reason is to give a clear overview of the data without overwhelming you with repetitive information.
If the density chart provides you with data beyond a week, you will encounter repeated occurrences of days due to the extended date range.
For instance, from the 7th of August to the 21st of August, you have 2 Sundays and three occurrences of the rest of the days.
And it would be complicated to showcase all three weeks’ data separately in the density chart.
SellerApp consolidates the data to streamline the information and shows you in a 7-day x 24-hour format.
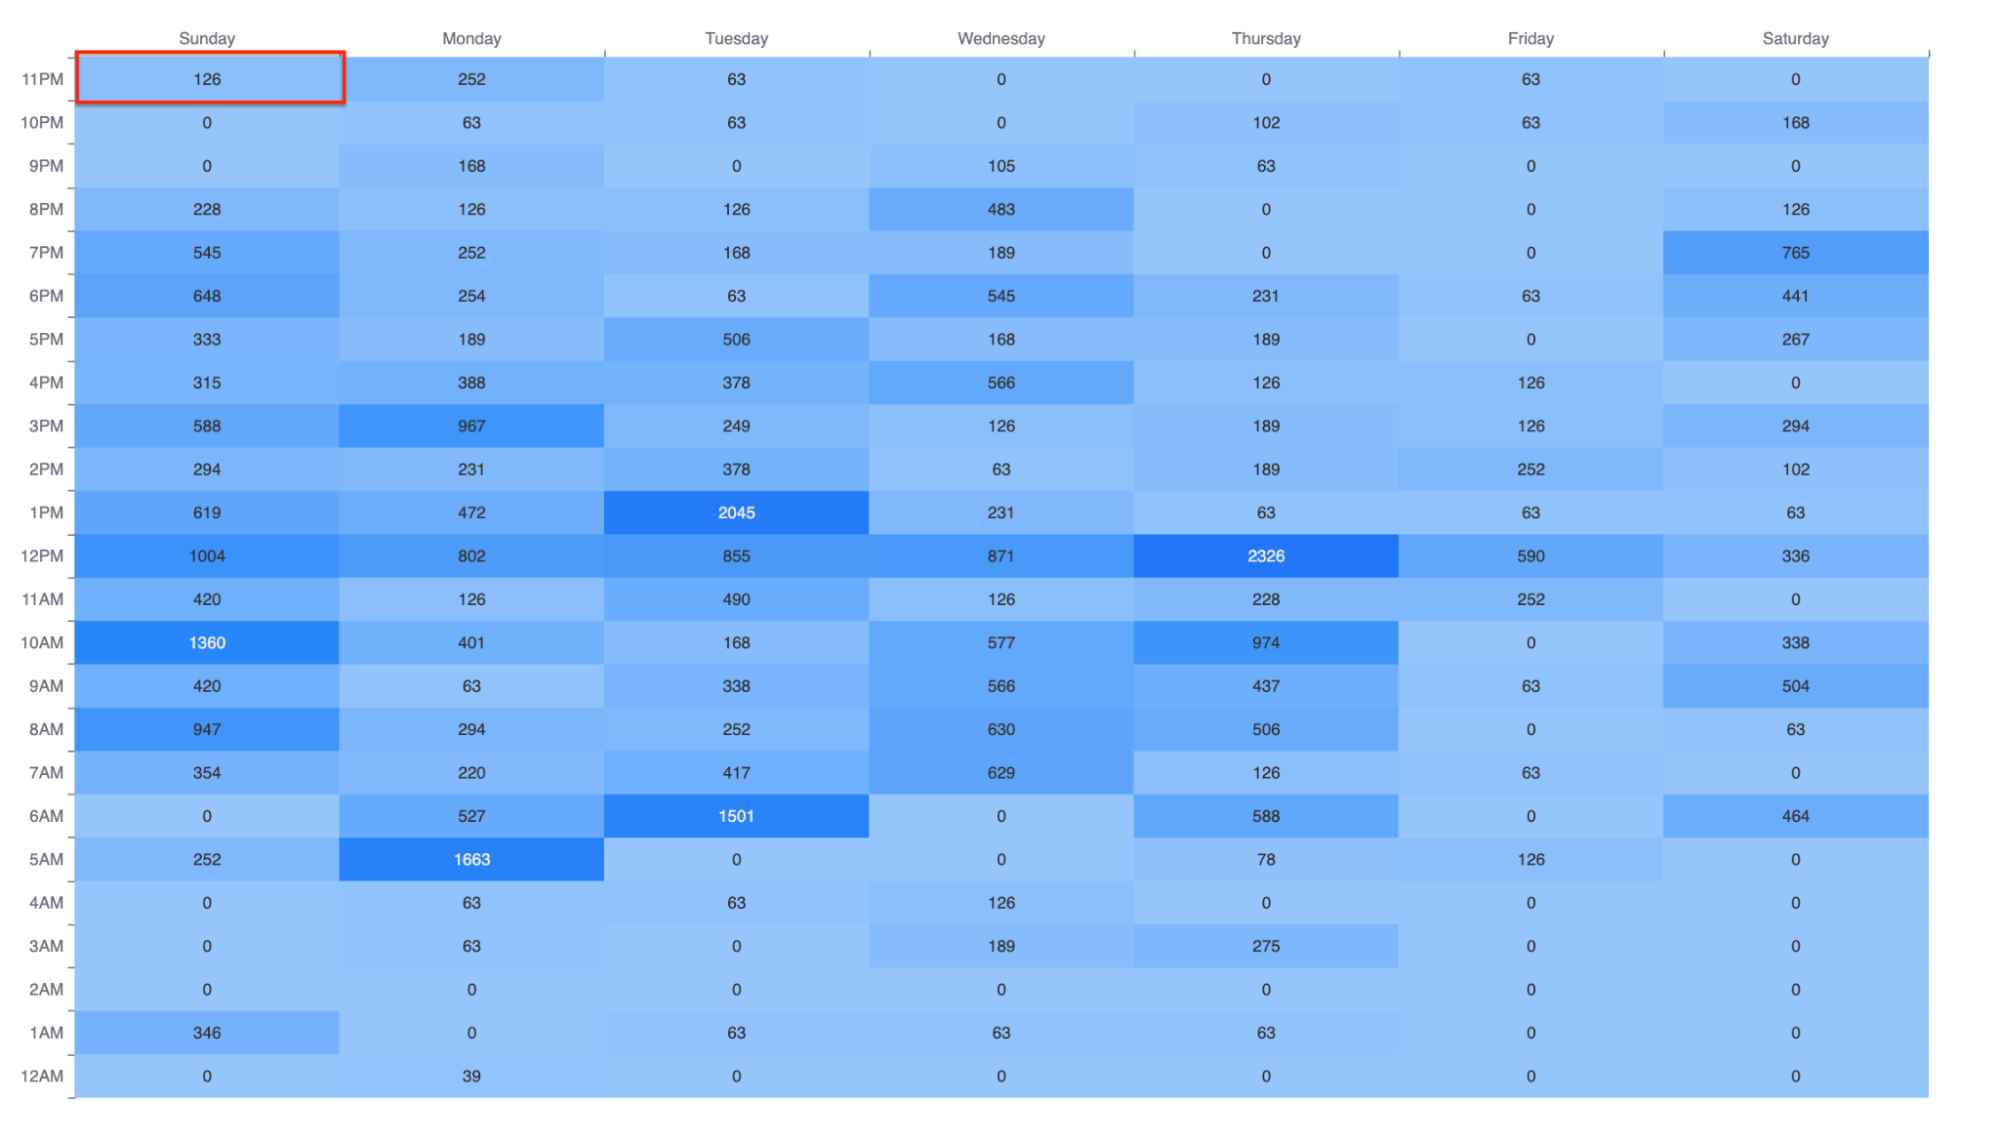
Let’s say you want to analyze the attributed sales at 11 p.m. on Sundays from 6th August to 21st August.
SellerApp combines attributed sales data from August 6th, 13th, and 20th (all Sundays in the specified range) for the 11 p.m. time frame and gives you the total attributed sales data for those Sundays.
Day of the Week View
Now, if you change the view to Day of the Week, you get an insight into the weekly trends. Here, instead of showing a density chart, SellerApp Stream gives you a graphical representation of the metrics movement for each day of the week.

For example, If you observe the highest attributed sales on Sundays for your campaign, adjust your marketing budget accordingly to get the most sales on Sundays.
Time of the Day View
To get more granular, filter the data based on the Time of the Day. It will show you how your selected metric performs within 24 hours of the day.

For instance, this graph shows that the highest attributed sales occur from 11 a.m. to 1 p.m., and the lowest occur from 9 p.m. to 4 a.m. Therefore, you can shift more of your advertising budget from the 9 p.m.- 4 a.m. to the 11 a.m. – 1 p.m. window to maximize your sales and reduce ACoS.
Note: If you select a date range for more than one day, the graph will display a total figure for all the combined days. This will help you understand the overall trend.
What to do next?
As you understand daily and hourly trends for your account/campaigns, use the SellerApp Automation tool to create dayparting campaigns.
Let’s say you’re running ads for your resistant band product. Here’s a step-by-step guide to setting up dayparting rules using Stream data.
Step 1: Analyze the Day and Time of the Week View
- Log into your SellerApp account and navigate to the Stream dashboard for your account.
- Choose the specific campaign you want to optimize, and then click on the “Day and Time of the Week View.” It provides an insightful breakdown of your campaign’s performance throughout the week in a density chart.
Let’s assume you’re running ads for your resistant band product, and you observe the following trends in your data:
- Peak Days: Sundays consistently show the highest attributed sales, followed by Wednesdays and Saturdays.
- Peak Hours: The peak hours for your campaign are 10 a.m. to 1 p.m. on Sundays, Saturdays, and Wednesdays.
- Low Performing Times: From 11 p.m. to 7 a.m., there are no attributed sales for each day of the week.
Step 2: Set Up Dayparting Rules
- Access the Automation Blueprint Dashboard: Just below the Stream density chart, you’ll find the “Setup Dayparting” button. Click on it to access the Automation Blueprint Dashboard.

- Select “Budget Management Rule”: Choose the “Budget Management” rule, and select the “Create blank dayparting rule” button.

- Choose Account or Campaign Level: Next, choose whether you want to create the dayparting on account level or campaign level. If campaign level, choose either all campaigns or select the campaign manually.

- Configure Dayparting Details: Now, set the specifics of your dayparting rule.
- Select the start and end dates for your dayparting schedule (e.g., August 1st to August 31st).
- Decide whether you want to override the campaign-level budget with your dayparting rule.
- Set your desired daily budget for the campaign. For instance, allocate a daily budget of $200 for your resistant band product campaign.

- Hourly Budget Split: Customize your hourly budget allocation based on Stream data.

Here’s a sample budget split for the campaign:
- Saturday, Sundays (High Converting Day):
- 10 a.m. to 1 p.m.: 100% (Allocate the entire budget during peak hours on Sundays when attributed sales are the highest)
- Wednesdays (Moderate Converting Day):
- 10 a.m. to 1 p.m.: 80% (Allocate a substantial budget during the peak hours on Wednesdays)
- 1 p.m. to 3 p.m.: 60% (A significant budget allocation during the early afternoon)
- Other Weekdays (Low Converting Days):
- 10 a.m. to 1 p.m.: 50% (Allocate a moderate budget during mid-morning to early afternoon)
- 1 p.m. to 3 p.m.: 40% (A reduced budget allocation during the early afternoon)
- 8 a.m. to 10 a.m.: 20% (A small budget for the morning hours)
- 3 p.m. to 6 p.m.: 30% (A moderate budget during late afternoon)
- 6 p.m. to 8 p.m.: 10% (A modest budget for the early evening)
- 8 p.m. to 10 p.m.: 5% (A minimal budget for the late evening)
- Nighttime Hours (Low Converting Hours):
- 11 p.m. to 7 a.m.: 0% (No budget allocated during nighttime hours)
With these dayparting rules, your campaign will dynamically improve conversions without wasting ad budget.
Keep in mind that these are just a demo dayparting to help you understand. It will always change based on your campaign’s actual performance and goals.
Regularly monitor and refine your dayparting rules to effectively optimize your resistant band product campaign.


