
How to Access and Use SellerApp Reports
So, you already have the data—sales, ads, refunds, conversions. However, it’s scattered across tabs, hard to clean, and nearly impossible to read at a glance.
SellerApp Reports takes that chaos and turns it into clear, actionable insights—no spreadsheets, no guesswork.
Whether you’re trying to understand why a product’s performance dipped, which campaigns are actually profitable, or where refunds are eating into your margin—this is your tool.
This guide walks you through how to access, create, customize, and share reports that help you move from “I think” to “I know.” Let’s get started.
Why Use SellerApp Reports?
Creating reports isn’t just a checkbox. It’s your shortcut to making faster, smarter, and way less stressful decisions. Here’s why SellerApp Reports are actually worth your time:
Zero Guesswork, All Strategy
No more “I think this campaign is doing okay?” vibes. With custom reports, you see what’s working (and what’s not) at a glance, so every dollar you spend on ads or inventory is intentional.
Tailored Insights for Real Business Decisions
Want to track refund spikes? Curious which keywords are carrying your sales? Need to know where you’re bleeding margin? Just turn on the widgets you care about. Boom—instant, relevant insights.
Save Hours Every Week
Automate the chaos. Instead of pulling data from 5 tabs and merging spreadsheets, just create one report that updates your core metrics. What used to take hours? Now takes minutes.
Collaborate Without Confusion
Easily share reports with your team, agency, or clients. Everyone gets the same view, the same metrics, and the same version of the truth.
Fully Custom, Zero Overwhelm
Whether you’re a data nerd or just here for the highlights, our preset widgets and bundles let you build reports your way. Start simple or go deep—it scales with you.
From Snapshot to Strategy
Seeing your metrics daily, weekly, or monthly helps you spot trends early, so you can act before a campaign slips or inventory runs dry.
In short? SellerApp Reports give you the power to stop reacting and start planning—with real-time visibility into your ads, sales, and profits, all in one place.
Your data has a lot to say. Reports help you hear it loud and clear.
Getting Started
First things first:
1) Log in to your SellerApp dashboard
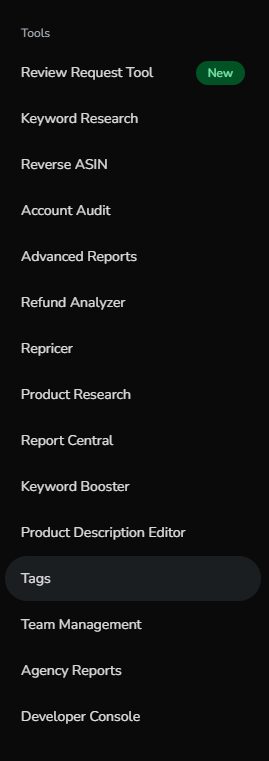
2) Head to the Tools section on the left-hand menu.
You’ll see an option called Agency Reports. Click it. Welcome to your reporting HQ.
3) This is where the magic happens
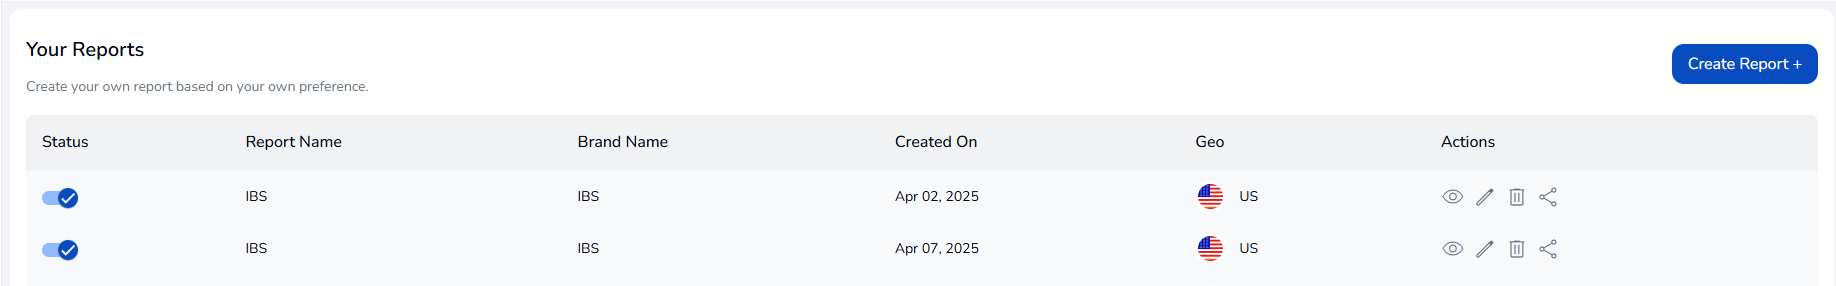
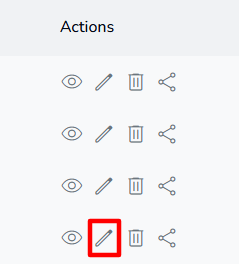
You’ll see all your existing reports listed by:
- Status
- Report Name
- Brand Name
- Created On
- Geography
- Actions (View. Edit. Delete. Share.)
How to Create a Custom Report (From Scratch)
Creating your own report isn’t just possible—it’s encouraged. Here’s how:
1) Click the bright and friendly Create Report button (top right corner of the page).
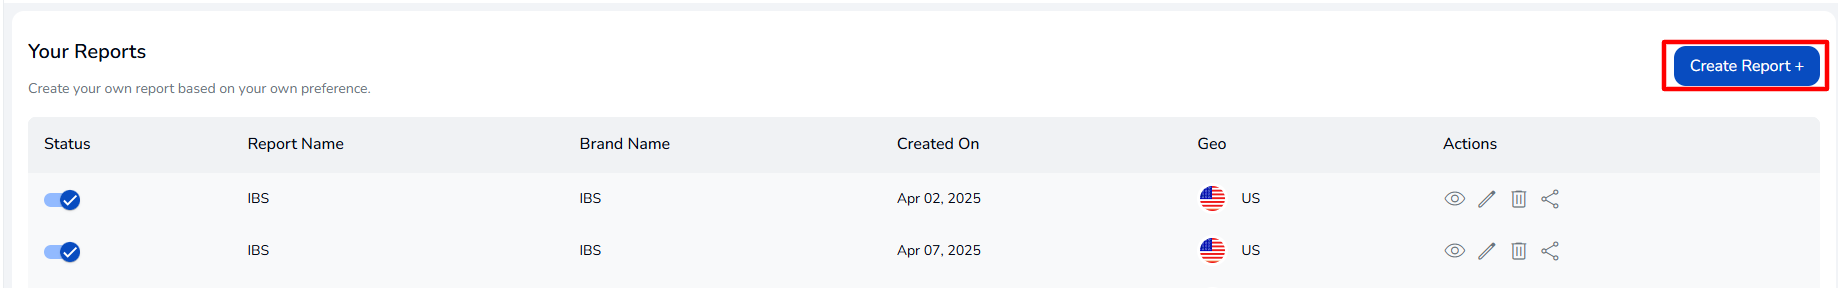
2) You’ll now be asked to fill out some info. Here’s what you’ll need:
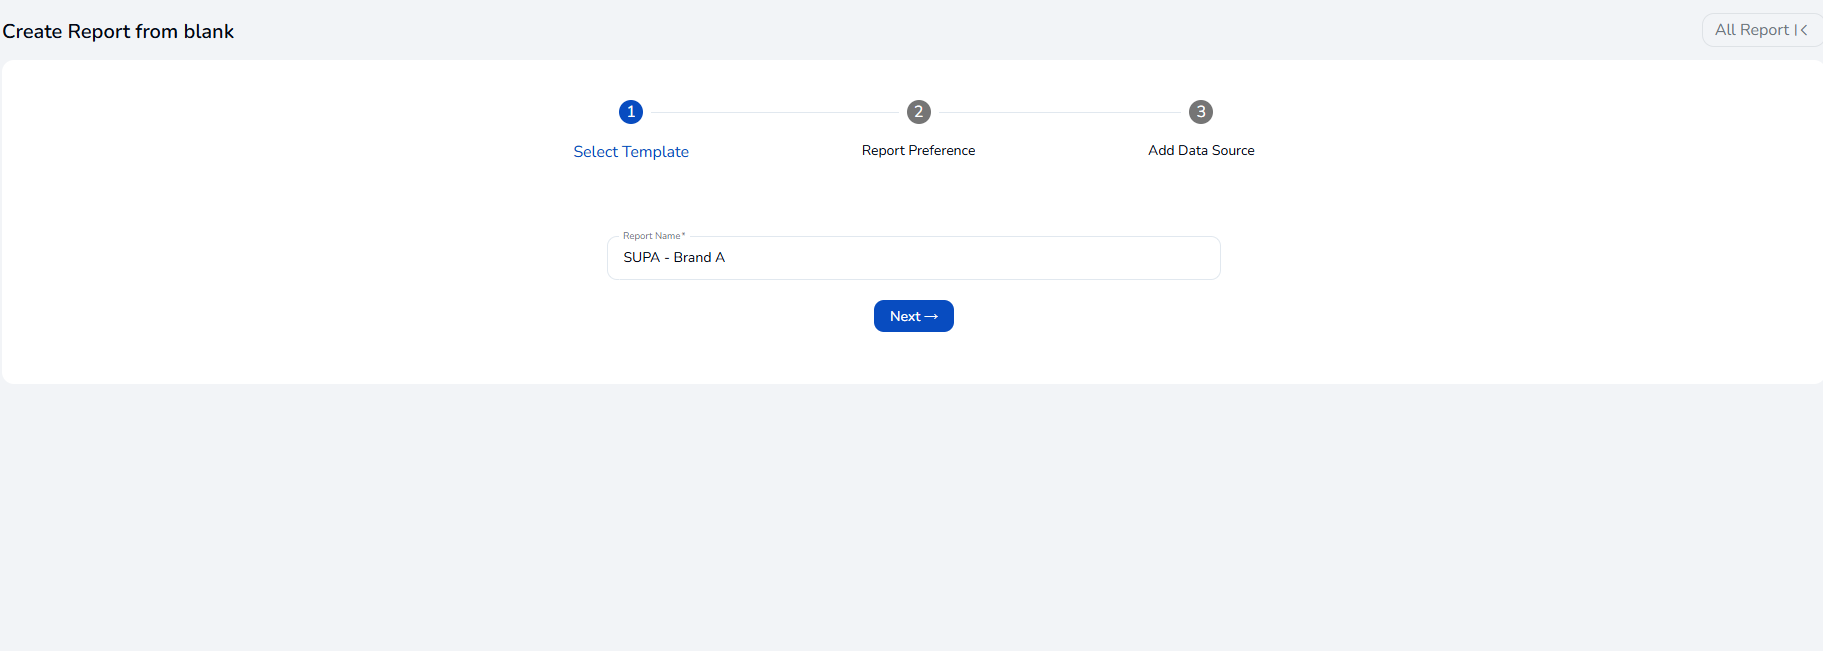
- Select Template
➤ Name your report. Be creative or keep it simple—your call.
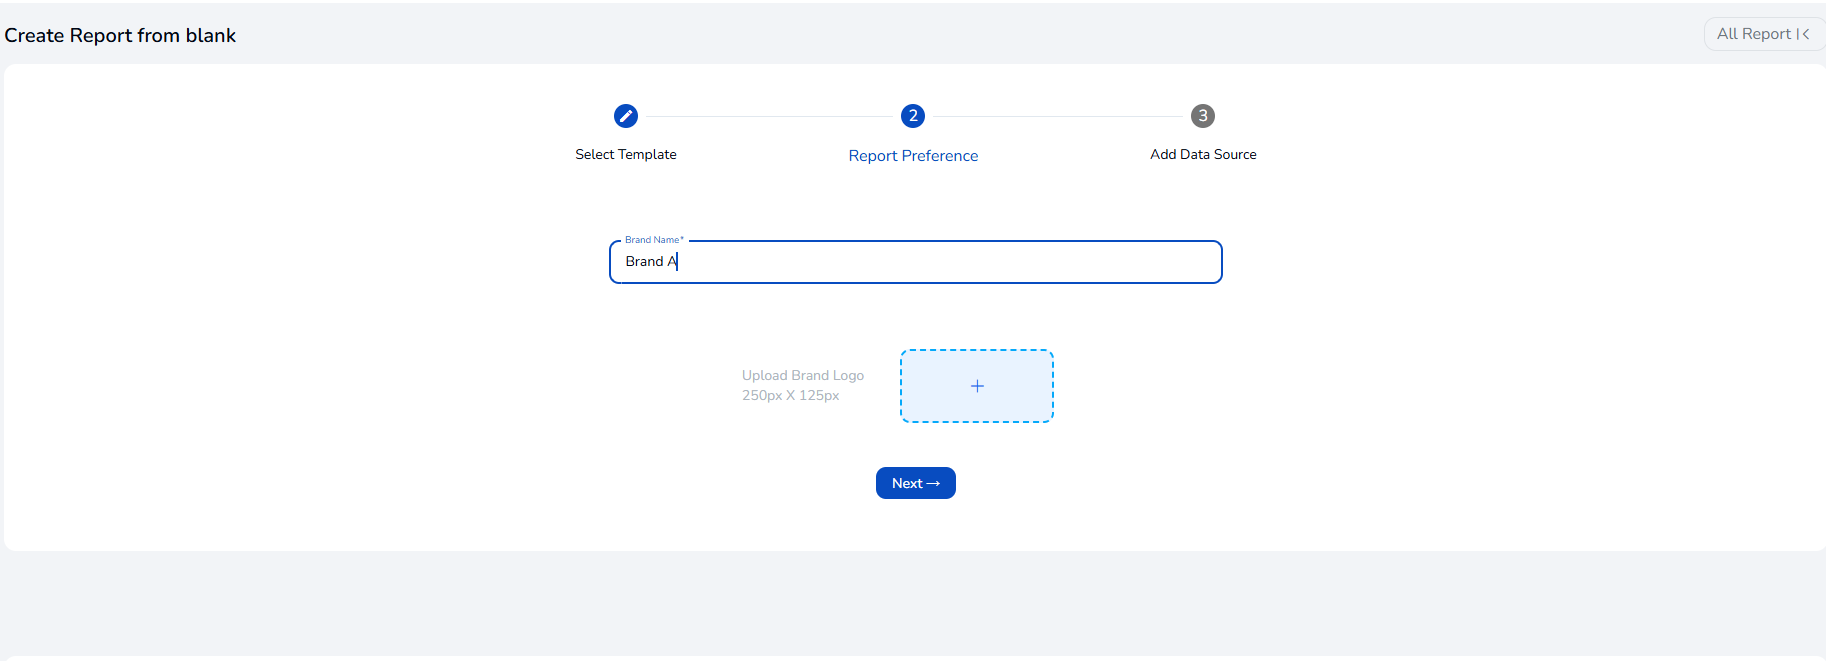
- Report Preference
➤ Add your brand name and upload the brand logo (250px x 125px if you’re being pixel-perfect).
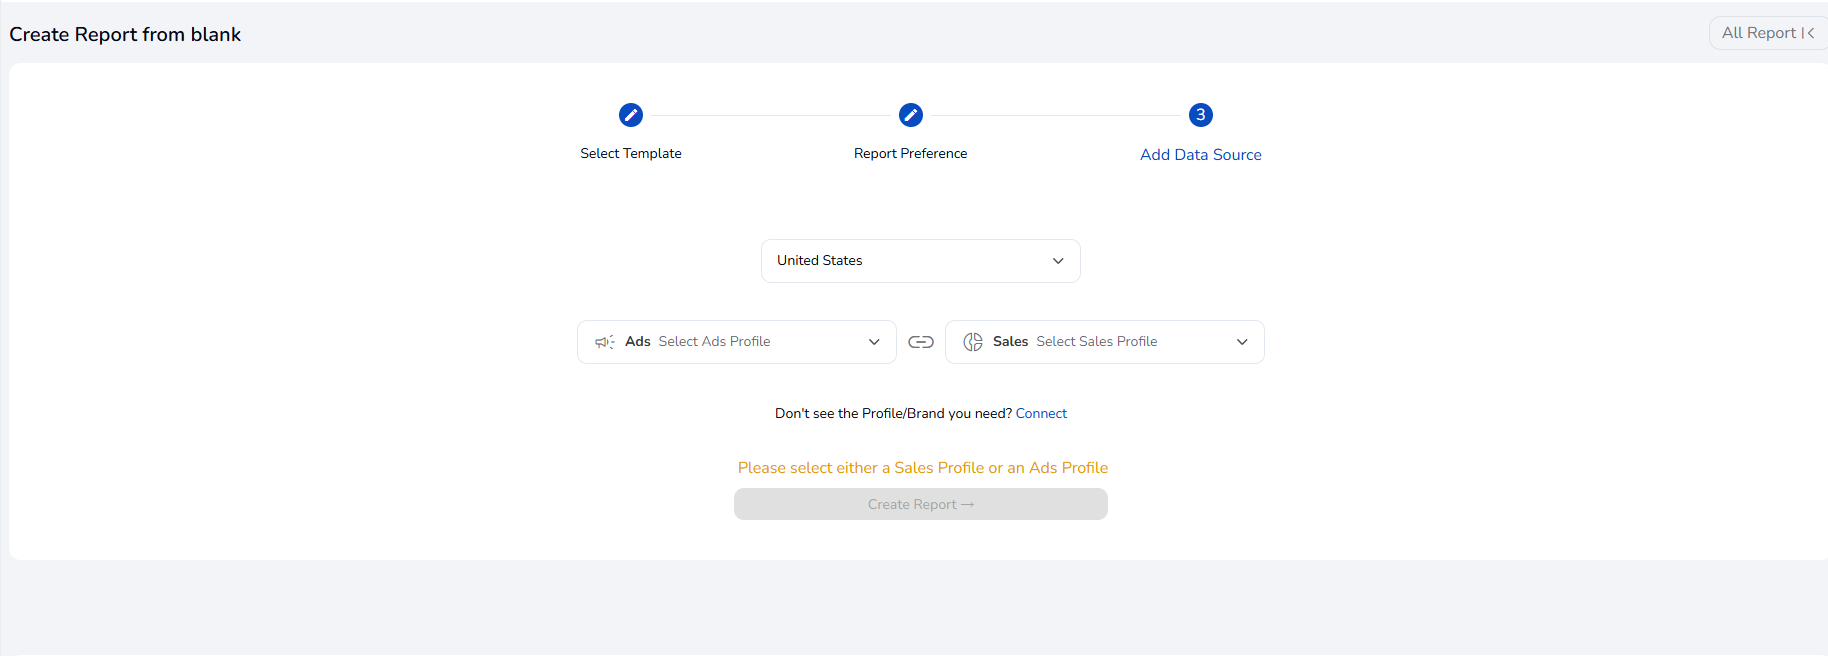
- Add Data Source
➤ Choose your Geography (yes, it’s required).
➤ Connect your Ads Profile and/or Sales Profile.
Pro tip: You need at least one of these to move forward. If you don’t see the one you want, hit “Connect.”
Done? Great. Now you’re officially a report creator.
Customizing Your Report
After creating a basic report, chances are you’ll want to spice it up with the right insights.
Here’s how:
1) Find your report and click Edit.
2) Hit Preset Widgets on the top menu.

3) Toggle on any metric you want to include.
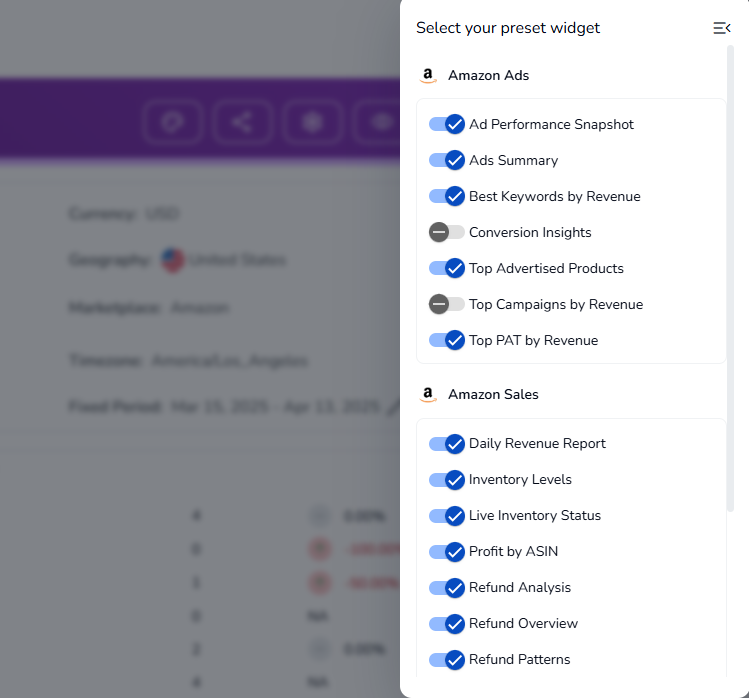
Amazon Ads Widgets:
- Ad Performance Snapshot
- Ads Summary
- Best Keywords by Revenue
- Conversion Insights
- Top Advertised Products
- Top Campaigns by Revenue
- Top PAT by Revenue
Amazon Sales Widgets:
- Daily Revenue Report
- Inventory Levels / Live Inventory Status
- Profit by ASIN
- Refund Overview / Patterns / by ASIN
- Regional Order Breakdown
- Revenue Overview
- Sales by Day
- Stock Summary
Everything you turn on becomes a component in your report. Add as much or as little as you like, this is your sandbox.
Not Sure What to Include? Use Preset Bundles.
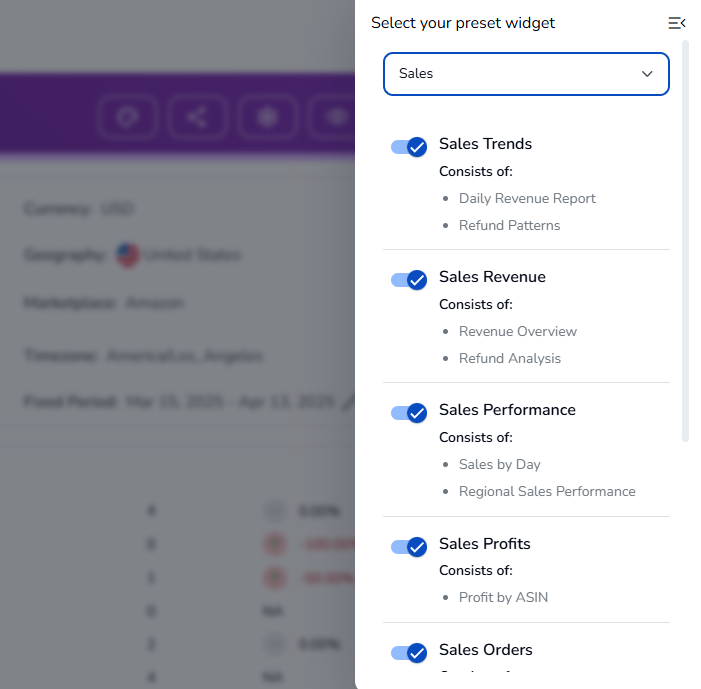
Feeling stuck? We’ve got pre-built widget bundles to match common goals. Just choose a preset:
Sales Trends
Includes:
- Daily Revenue Report
- Refund Patterns
Sales Revenue
Includes:
- Revenue Overview
- Refund Analysis
Sales Performance
Includes:
- Sales by Day
- Regional Sales Performance
Sales Profits
Includes:
- Profit by ASIN
These bundles are great when you’re in a hurry or just want to make sure you’re covering your bases.
Important Report Details To Keep a Track of
- Add a logo
- Report by: You, or your team member’s name
- Generated on: Automatically populated
- Currency: USD (or your currency)
- Geography: e.g., United States
- Marketplace: Amazon
- Timezone: e.g., America/Los_Angeles
Date Ranges
Pick from:
- Fixed Period (e.g., Mar 15 – Apr 13, 2025)
- Moving Date Ranges. (Last 7 / 14 / 30 / 60 / 90 Days and more)
How to Share & Download Your Reports
You can only download a report when you’re in Share or Preview Mode. So:

- Click Preview to get a quick view.
- Hit Share if you want to send it out.
- From either mode, you’ll see the Download option.
Just like that, your insights are ready to impress.
Final Tips
- You don’t have to be a data wizard to get value from SellerApp Reports.
- Start small: one brand, one geography, a few widgets.
- Explore the toggles and presets—you’ll be surprised what you discover.
- And yes, you can always come back and edit later. Nothing’s locked in stone.
Still have questions?
Our team is one click away. Reach out from the dashboard chat or drop us a line—we’re real humans who love a good data story.
