
SellerApp Sales Dashboard: A Complete Guide
The SellerApp Sales Dashboard is a powerful, all-in-one solution designed to help Amazon sellers gain actionable insights into their business performance. With detailed metrics and advanced analytics, this dashboard empowers sellers to make informed decisions across key operational areas such as profits, inventory, refunds, and customer behavior.
By taking advantage of the comprehensive data provided, you can:
- Optimize profitability with in-depth product and account-level insights.
- Monitor sales trends and compare performance over time.
- Forecast inventory needs and avoid stockouts or overstocking.
- Identify areas for improvement to minimize losses and boost growth.
- And much more.
The Sales Dashboard simplifies complex data, delivering it in a way that allows you to focus on the strategies that drive results.
Benefits of using the SellerApp Sales Dashboard
1) Sales Profit Tracking
- Analyze your sales performance and ROI at an in-depth level with the net profit chart. Gain a thorough understanding of the top-level spends, profits, sales, and orders.
2) Profit Tracking at Account/Product Level
- With access to customizable filters, analyze profitability for each specific product according to their marketplace, specific time frame, and against the investments you made on the item, after inventory, and advertising costs.
3) Sales Trends and Comparison
- Identify and compare sales trends across different time periods. Our Sales dashboard predicts trends in product sales, with intelligent adjustments on the costs to maximize your margins.
4) Inventory Management
- Never lose your sales momentum or product ranking. Our proprietary algorithms will alert you whenever a product is running low on inventory and needs restocking. Restock your inventory based on profits, and not on inventory levels. Identify the outliers with product-level inventory and sales data.
5) Forecasting
- Stay prepared and well-stocked with SellerApp’s data-backed sales forecasting and inventory alerts. Gauge product demand ahead of time and get alerts to maintain your sales momentum. Precisely ascertain the number of days your inventory will last with an advanced forecasting system. Leverage the smart forecasting algorithm to maintain the right stock levels even during peak shopping seasons.
How to access this feature?
Login to the https://dashboard.sellerapp.com/loginSellerApp dashboard > Sales
Note: You can view reports only if your Seller Central account is synced with the SellerApp dashboard for real-time data updates.
Key Features and Insights Available on the Sales Dashboard
The Sales Dashboard typically provides a range of features to monitor and manage sales performance effectively. Some common features you might find include:
Overview
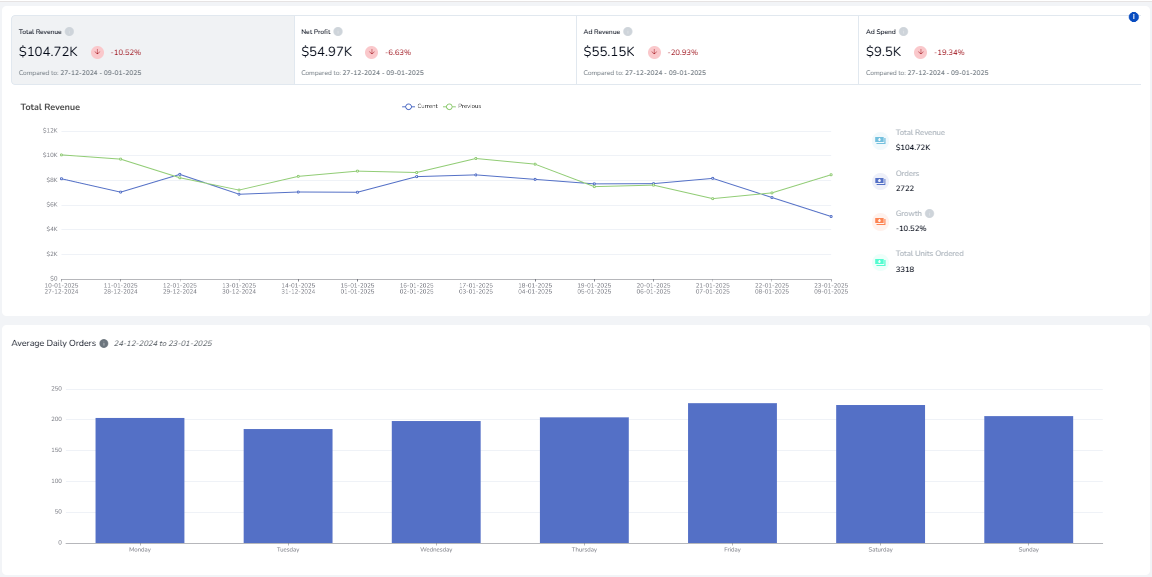
The Overview section offers a high-level snapshot of your store’s performance. It consolidates critical metrics such as total sales, average order value, and top-performing products, allowing you to assess overall business health at a glance. This section also displays graphical trends, making it easy to spot patterns and track progress over time.
Moreover, SellerApp’s simplified user interface allows you to sort and filter the key parameters before viewing the data for any specified time period.
Select a date range and get a clear snapshot of your inventory levels and sales. With SellerApp, you can retrieve reports by choosing from a flexible time frame. We provide a historical trend of sales data that lasts beyond 90 days.
That means we give you the flexibility to review your sales across a time frame ranging from the previous day up to the date that you connected your Seller Account to SellerApp.
Key Metrics:
1) Total Revenue
- Definition: Total revenue indicates the proceeds obtained from sales of products organically and inorganically on Amazon.
2) Net Profit
- Definition: Net Profit estimates your final profit after deducting all your income and expenses, including COGS and other outside Amazon expenses.
3) Ad Revenue
- Definition: The total revenue generated from product sales inorganically.
4) Ad Spend
- Definition: The amount of money spent on advertising for a keyword or product.
5) Average Daily Orders
- Definition: Average Daily Sales (ADS) computes the average number of orders each day of the week for the entire duration of the sales cycle. E.g- In the last 14 days, the 2 Wednesdays have garnered 50 and 70 orders respectively. So your ADS for Wednesday would be 60 orders.
Use the filters to customize the displayed data by date range, marketplace, or product category for more granular insights.
Profits
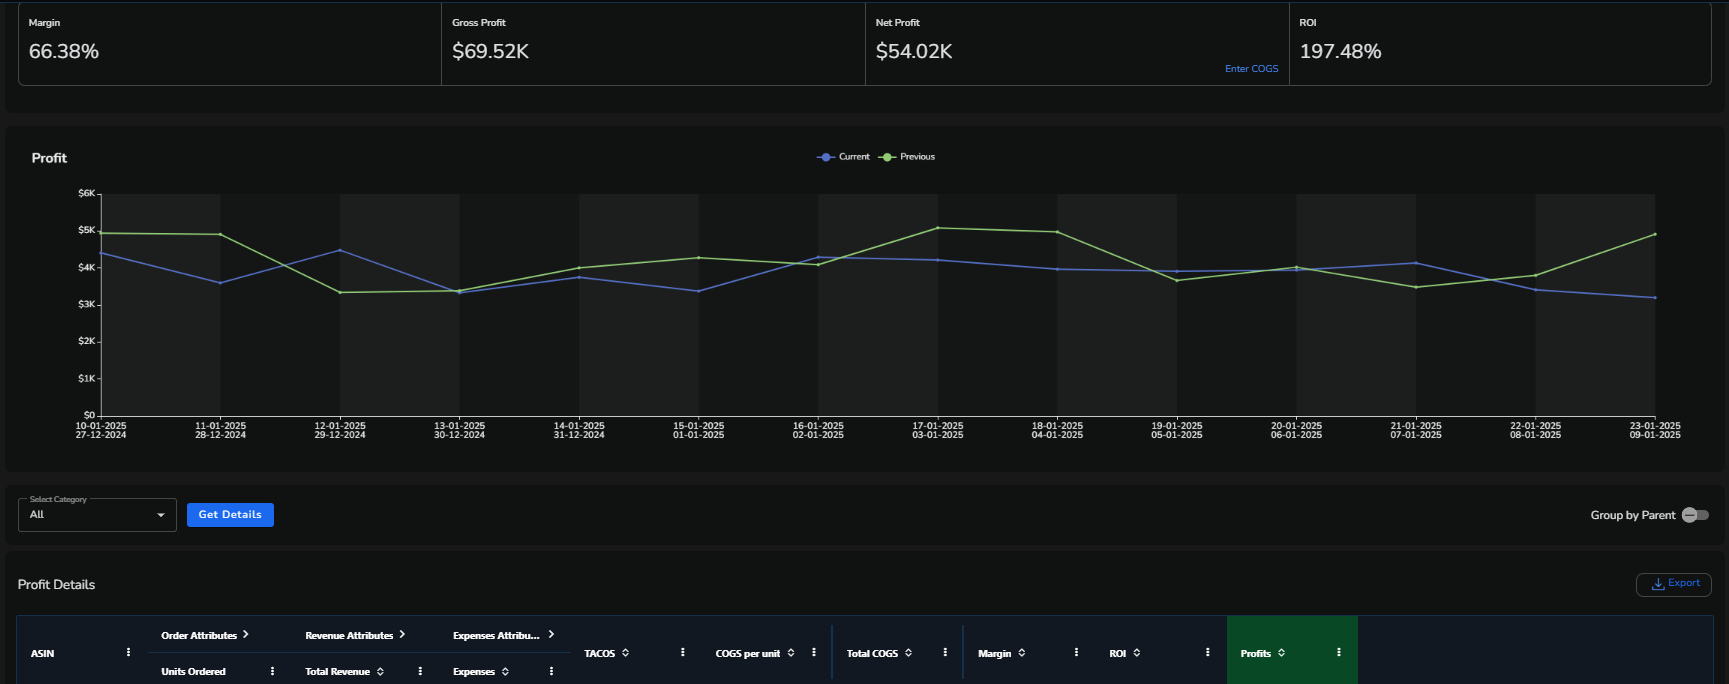
The Profits section dives deep into your financial performance, detailing your profit margins and expenses. It helps you understand where your money is going and which areas can be optimized for better profitability.
Profit Metrics
1) Margin
- Definition: The percentage of revenue that remains as profit after deducting costs. It is a key indicator of overall profitability.
- Example: 68.93%.
2) Gross Profit
- Definition: The total profit earned after subtracting the cost of goods sold (COGS) from the total revenue, but before deducting operating expenses, taxes, or other costs.
- Example: $74.69K.
3) Net Profit
- Definition: The profit remaining after all costs, including COGS, operating expenses, taxes, and other deductions, have been accounted for.
- Example: $57.49K.
4) ROI (Return on Investment)
- Definition: A measure of the profitability of an investment, expressed as a percentage of the investment’s cost.
- Example: 221.82%.
5) Enter COGS
- Definition: A manual input field or section where the cost of goods sold (COGS) per unit or in total can be entered to calculate profits and margins accurately.
Profit Analysis Metrics
1) Select Category
- Definition: A filter to view profit metrics for specific categories of products or services (e.g., Tools, Services, All).
- Usage: Allows for targeted analysis of profitability by category.
2) Group by Parent
- Definition: A grouping option that aggregates profit data based on parent ASINs or product groups, simplifying the analysis of profitability across related items.
3) Profit Details
- Definition: A detailed breakdown of revenue, expenses, and profits for specific products, categories, or time frames.
Example:
- COGS per Unit: $10.
- Total COGS: $1,440.
- Margin: 68%.
- ROI: 220%.
- Profit: $800.
5) TACOS (Total Advertising Cost of Sales)
- Definition: The percentage of total revenue spent on advertising. It helps measure the profitability of ad campaigns relative to overall sales.
- Usage: Lower TACOS indicates more efficient advertising.
6) COGS (Cost of Goods Sold)
- Definition: The total cost incurred in producing or purchasing the products sold during the specified time period.
- Usage: Accurate COGS is critical for calculating gross profit and ROI.
Visual charts in this section provide an intuitive way to analyze your profit trends and identify areas of improvement.
Customers
The Customers section focuses on your audience and their purchasing behavior. Understanding customer insights can help tailor your strategies to improve engagement and loyalty.

Customer Metrics
1) Total Orders
Definition: The total number of purchase transactions made by all customers during the specified time frame.
Example: 2.75K orders.
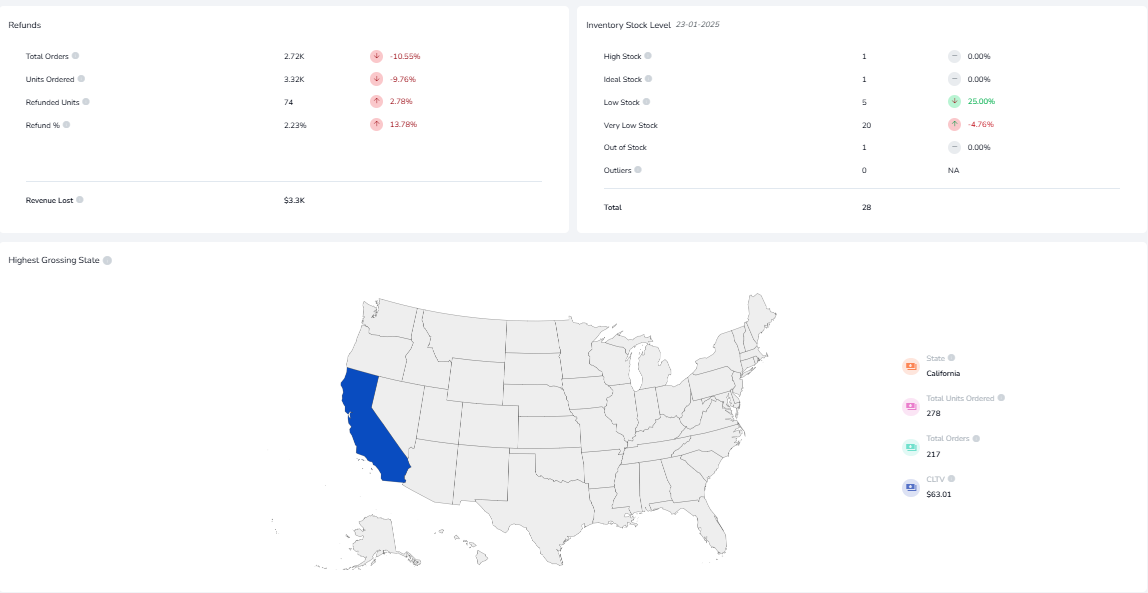
2) Highest Grossing State
Definition: The state with the highest total revenue generated from customer purchases.
Usage: Helps identify key geographical regions contributing the most to sales.
Example: California.
3) Customer
Definition: The unique identifier (e.g., email address or ID) of an individual customer in the system.
4) Most Repeat Purchase Product
Definition: The product (identified by its ASIN) purchased the most frequently by the same customers over time.
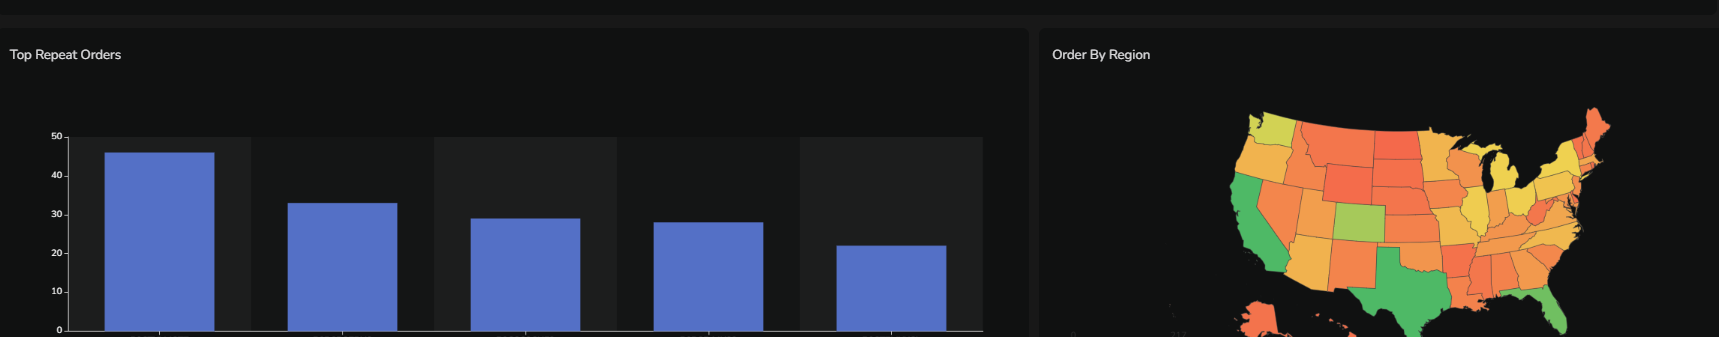
5) Top Repeat Orders
Definition: A list of products or orders that customers have repeatedly purchased, categorized by region or other factors.
Usage: Helps determine which products drive loyalty and consistent demand.
6) Brand Loyalty
- Definition: A measure of customer retention, showing the percentage of customers who return to make repeat purchases for the same product or brand.
- Usage: Higher brand loyalty indicates customer satisfaction and product success.
7) Customer Details
Definition: A detailed list of customers who have made repeat purchases, including their location, product, and number of repeat transactions.
Example:
- Customer: Customer C.
- Location: California.
- No. of Repeat Purchases: 3
8) List of Customers Who Made a Repeat Purchase
- Definition: A comprehensive list of customers who have purchased the same product or ASIN more than once. This is an indicator of loyalty to specific items.
- Usage: Helps track loyal customers and analyze buying patterns.
Order by Region
- Definition: A breakdown of customer orders grouped by geographical regions to show where repeat orders and brand loyalty are strongest.
- Usage: Identifies key markets and potential growth areas.
This section includes actionable recommendations, such as offering loyalty programs or targeted discounts to enhance customer retention.
Refunds
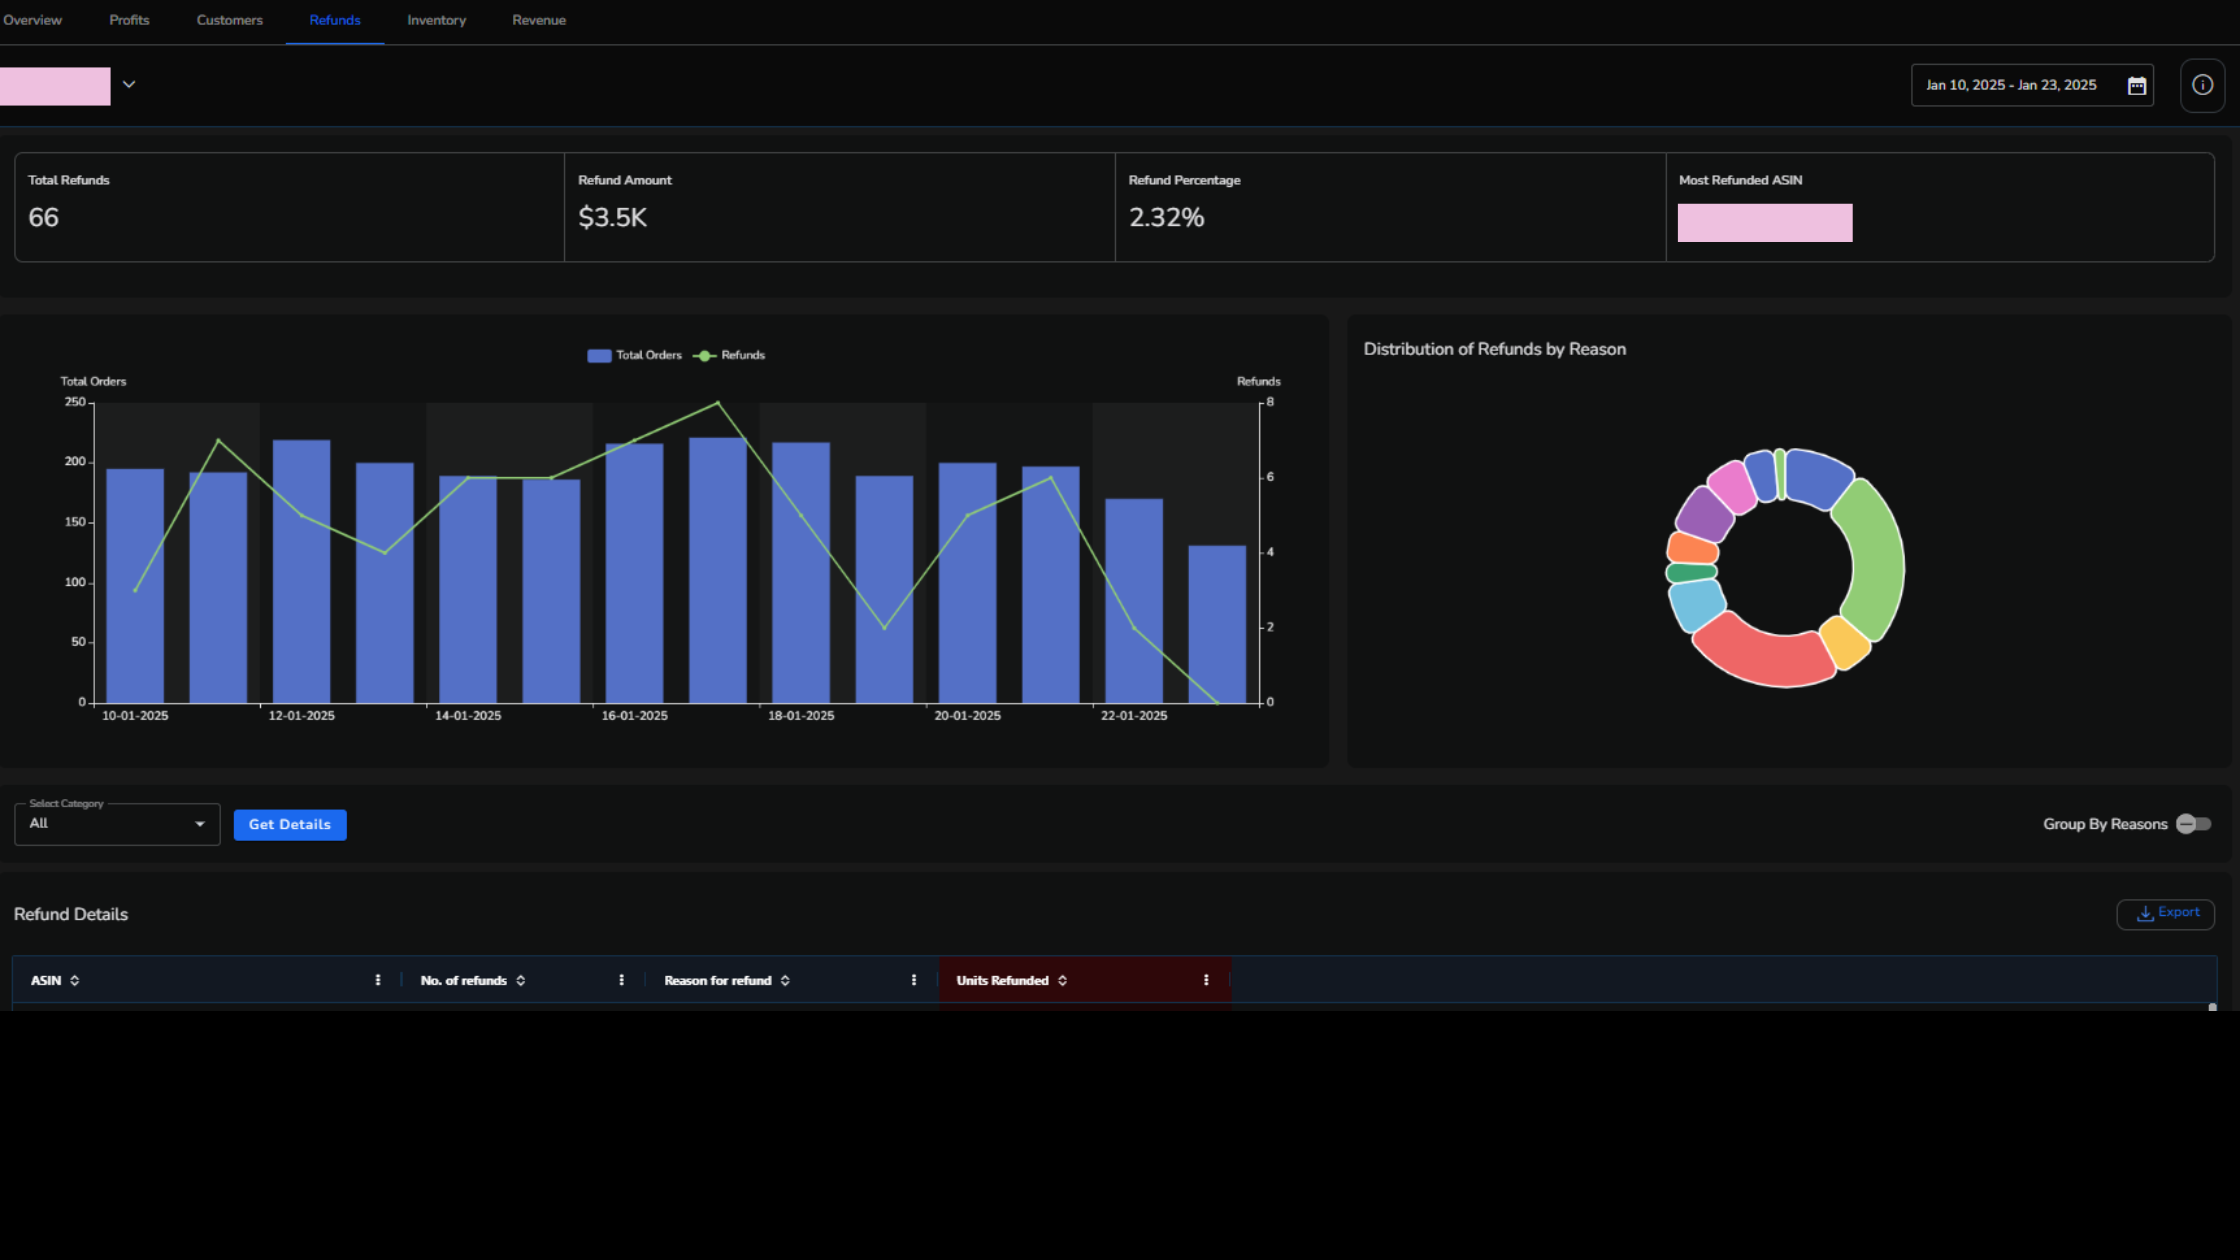
The Refunds section helps you track and manage returns, providing clarity on their impact on your overall performance. This section ensures transparency and highlights areas needing improvement to reduce refund rates.
Refund Metrics:
- Total Refunds
- Definition: The total number of refund transactions processed within a specified period. Each refund corresponds to an order or a unit returned by the customer.
- Example: 62 refunds.
- Refund Amount
- Definition: The total monetary value of refunds issued to customers, typically including the product price and any applicable taxes or fees.
- Example: $3.23K.
- Refund Percentage
- Definition: The proportion of total refunds compared to the overall orders, expressed as a percentage.
- Example: 2.15% refund rate.
- Most Refunded ASIN
- Definition: The product (identified by its ASIN) with the highest number of refunds within the analyzed time frame.
Refund Distribution Metrics
1) Distribution of Refunds by Reason
Definition: A breakdown of refunds categorized by specific reasons (e.g., damaged item, wrong item received, late delivery).
Usage: Helps identify patterns or recurring issues causing customer dissatisfaction.
Example:
- Reason: Damaged Item → 20 refunds.
- Reason: Wrong Item → 15 refunds.
2) Refund Details
Definition: A detailed log of refund transactions for each ASIN, including the number of refunds, units refunded, and specific reasons for the refund.
- Total Refunds: 10.
- Reason: “Defective Product” → 6 units refunded.
3) Group By Reasons
Definition: A filter or analysis tool that groups refund data by reason to simplify and visualize the causes of refunds.
Example:
- Late Delivery → 5 refunds.
- Product Quality Issues → 12 refunds.
Take advantage of these insights to identify patterns and implement measures like improving product descriptions, quality checks, or packaging.
Inventory
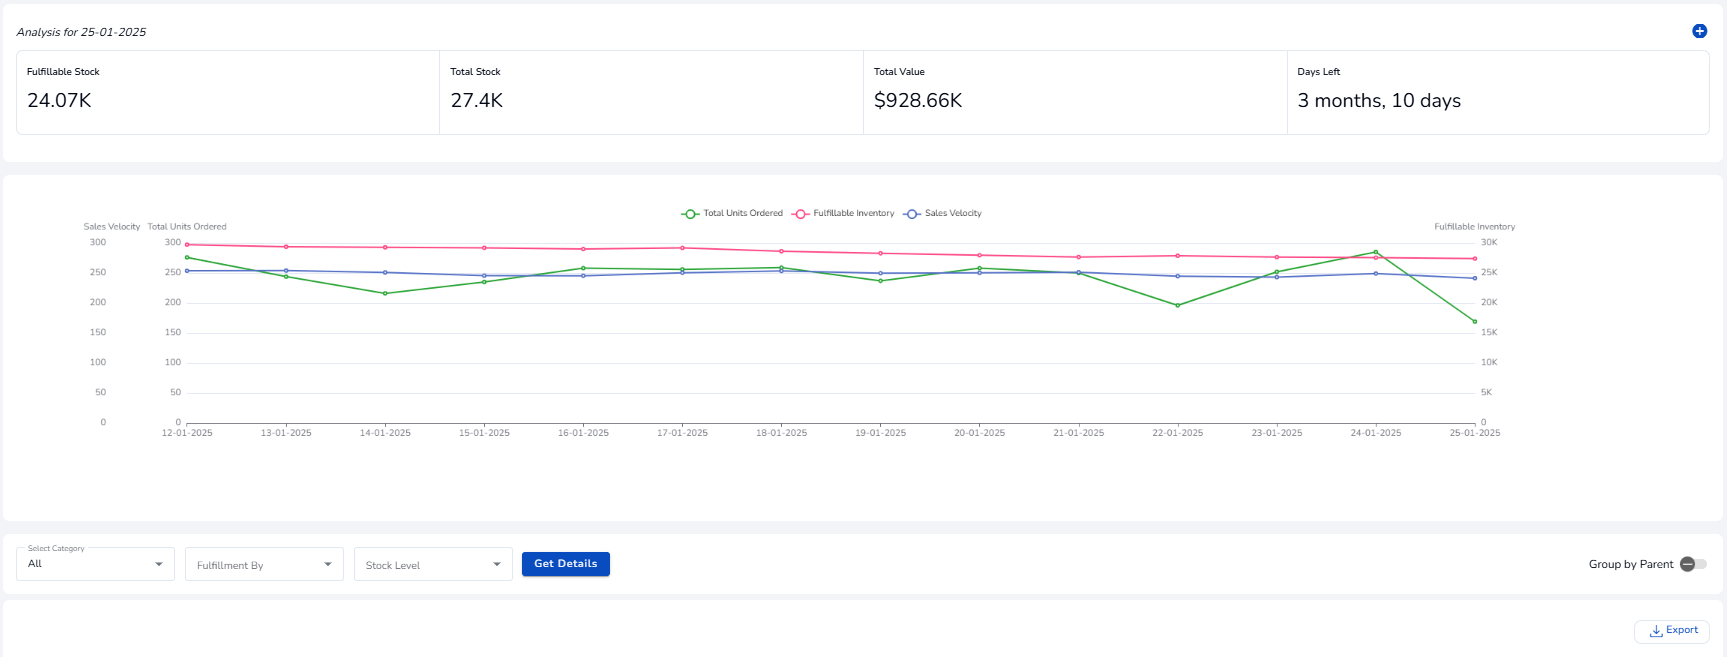
The Inventory section provides real-time updates on stock levels, helping you avoid overstocking or running out of popular items. It’s designed to optimize inventory management and improve your supply chain.
Select a custom date range to view reports for inventory levels of all the SKUs – this includes all your product variants, units in stock, inventory cost, and inventory retail amount.
Inventory Metrics
1) Fulfillable Stock
Definition: The quantity of stock currently available in the warehouse that is ready to be picked, packed, and shipped to customers.
Example: 24.07K units.
2) Total Stock
Definition: The total inventory available, including both fulfillable and non-fulfillable stock (e.g., damaged or unsellable inventory).
Example: 27.4K units.
3) Total Value
Definition: The monetary value of the total inventory in stock, calculated as the quantity of each SKU multiplied by its cost or selling price.
Example: $928.66K.
4) Days Left
Definition: The estimated number of days the current stock will last based on the sales velocity and demand trends.
Example: 3 months, 10 days.
5) Sales Velocity (Total Units Ordered)
Definition: The average number of units sold per day or over a specific time frame. It helps predict future inventory needs.
Example: 300 units ordered per day across categories like tools and services.
FBA Metrics
1) ASIN (Amazon Standard Identification Number)
Definition: A unique identifier assigned to each product in the Amazon catalog, used to track and manage inventory.
2) SKU (Stock Keeping Unit)
Definition: A unique identifier assigned to individual products or product variations by the seller, used for inventory management.
3) Category
Definition: The product category (e.g., Tools, Industrial & Scientific) that helps organize and track inventory by type.
4) FBA Unsellable Inventory
Definition: Stock in Amazon’s Fulfillment Centers that is damaged, defective, or otherwise unsellable to customers.
5) FBA Warehouse Total Stocks
Definition: The total inventory count stored across all Amazon fulfillment centers.
6) Total Fulfillable Inventory
Definition: The total number of units in stock that can be shipped to customers through FBA (Fulfillment by Amazon).
Stock Management Metrics
1) Restock Days
Definition: The estimated number of days left before stock needs to be replenished, based on sales velocity and current stock levels.
2) Restock Quantity
Definition: The number of units recommended for replenishment to maintain inventory flow and avoid stockouts.
3) Stock Level
Definition: A snapshot of current inventory levels, typically categorized by fulfillable, non-fulfillable, and total stock.
Ultimately, this section enables proactive decision-making, such as running promotions on overstocked items or adjusting reorder quantities.
Revenue
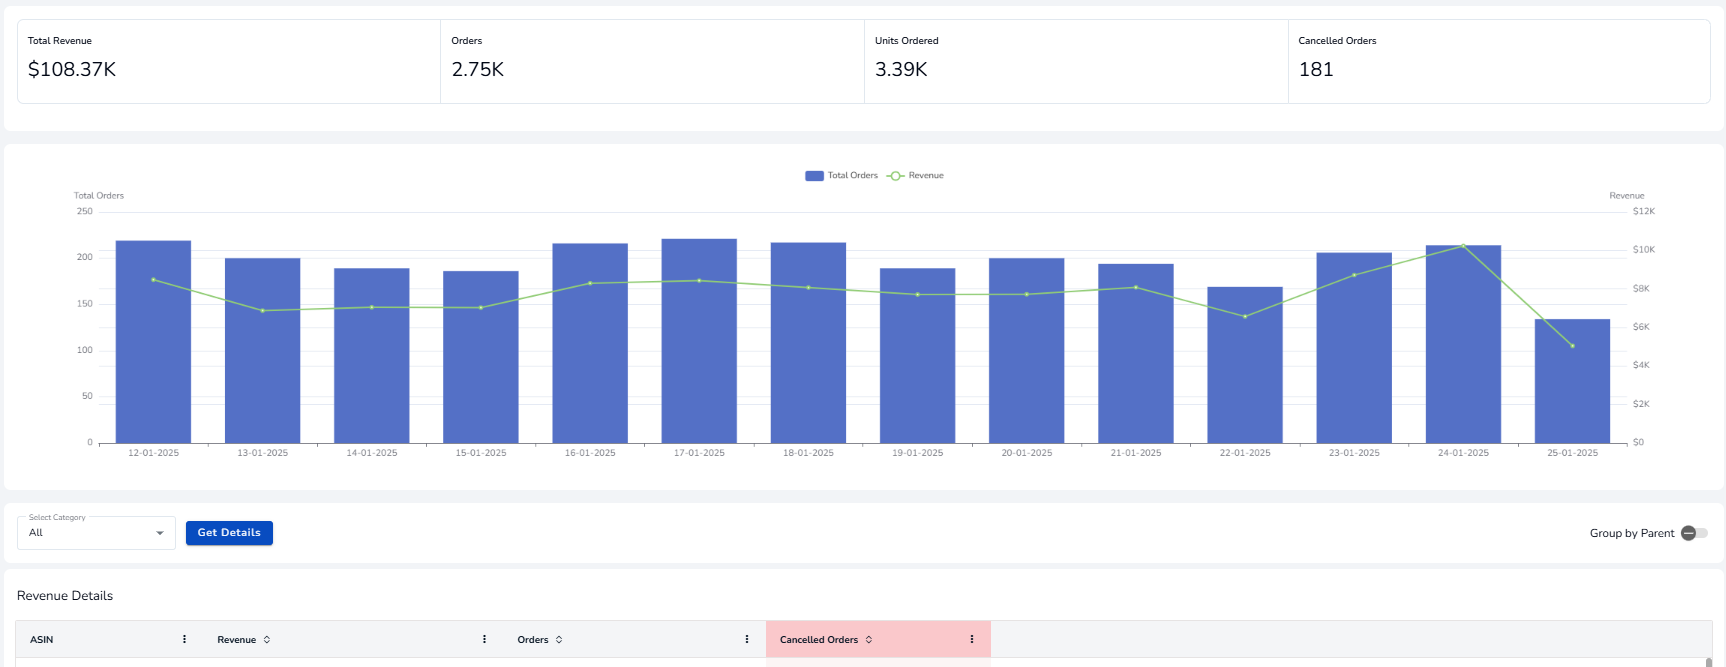
The Revenue section offers a detailed breakdown of your income streams, providing clarity on which channels and products drive the most sales.
Key Revenue Metrics:
1) Total Revenue
Definition: The total income generated from all completed sales within the specified time frame, before deducting costs or expenses.
Example: $108.37K.
2) Orders
Definition: The total number of orders placed by customers, regardless of the number of units included in each order.
Example: 2.75K orders.
3) Units Ordered
Definition: The total quantity of individual items purchased across all orders. This reflects the volume of items sold rather than the number of transactions.
Example: 3.39K units.
4) Cancelled Orders
Definition: The number of orders that were canceled by customers or sellers before fulfillment. This metric helps monitor order-related issues or trends.
Example: 181 canceled orders.
Graphs and charts make it easier to identify revenue trends and align your strategies accordingly, whether it’s focusing on high-performing products or diversifying into new marketplaces.
The SellerApp Sales Dashboard equips you with comprehensive tools to monitor and optimize your business performance. By analyzing each section—Overview, Profits, Customers, Refunds, Inventory, and Revenue—you can make data-driven decisions to boost profitability and growth.
For further assistance, feel free to explore our knowledge base or contact our support team: support@sellerapp.com | sales@sellerapp.com
